

Question: A student performed an experiment with three different grips to see what effect it might have on the distance of a backhanded Frisbee throw.
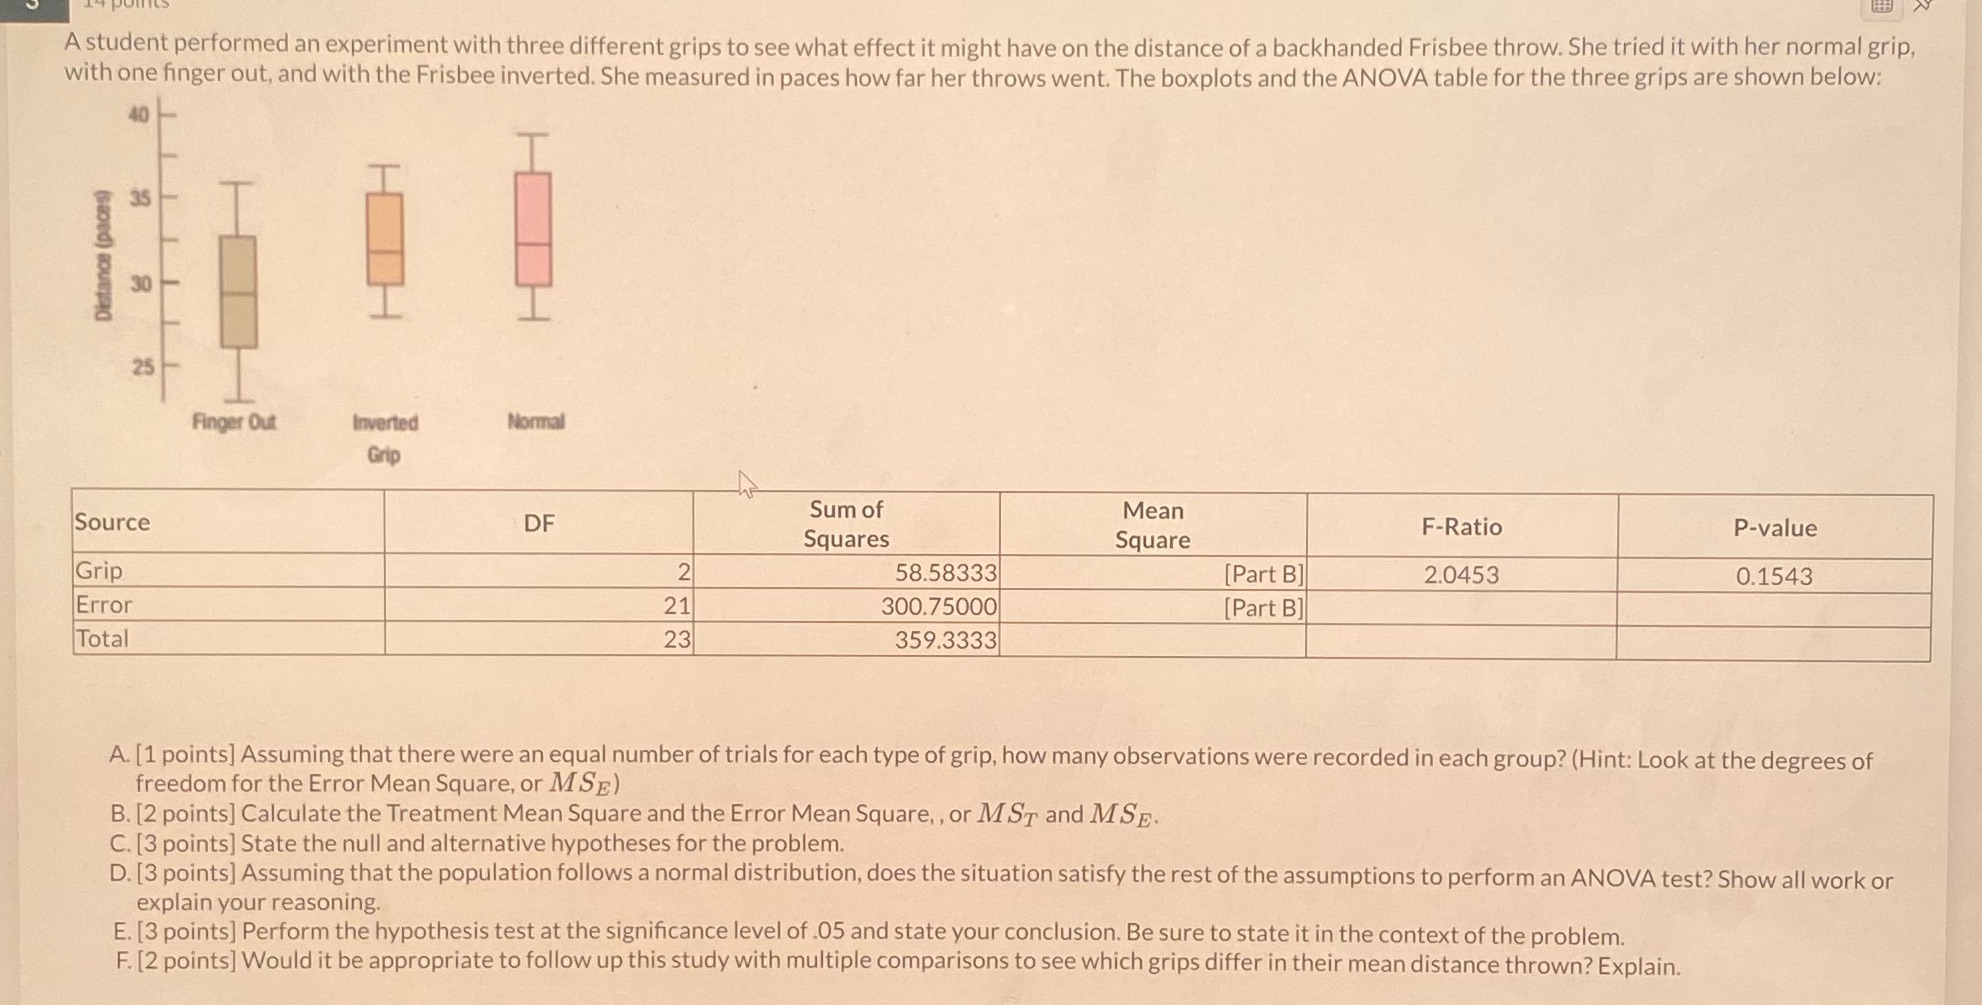
A student performed an experiment with three different grips to see what effect it might have on the distance of a backhanded Frisbee throw. She tried it with her normal grip, with one finger out, and with the Frisbee inverted. She measured in paces how far her throws went. The boxplots and the ANOVA table for the three grips are shown below: Distance (paces) B 80 25 Finger Out Inverted Grip Normal Source Grip Error Total DF 2 21 23 Sum of Squares Mean Square F-Ratio P-value 58.58333 300.75000 359.3333 [Part B] [Part B] 2.0453 0.1543 A. [1 points] Assuming that there were an equal number of trials for each type of grip, how many observations were recorded in each group? (Hint: Look at the degrees of freedom for the Error Mean Square, or MSE) B. [2 points] Calculate the Treatment Mean Square and the Error Mean Square,, or MST and MSE. C. [3 points] State the null and alternative hypotheses for the problem. D. [3 points] Assuming that the population follows a normal distribution, does the situation satisfy the rest of the assumptions to perform an ANOVA test? Show all work or explain your reasoning. E. [3 points] Perform the hypothesis test at the significance level of .05 and state your conclusion. Be sure to state it in the context of the problem. F. [2 points] Would it be appropriate to follow up this study with multiple comparisons to see which grips differ in their mean distance thrown? Explain.
Step by Step Solution
There are 3 Steps involved in it

Get step-by-step solutions from verified subject matter experts