

Question: A study compared three display panels used by air traffic controllers. Each display panel was tested for four different simulated emergency conditions. Twenty-four highly
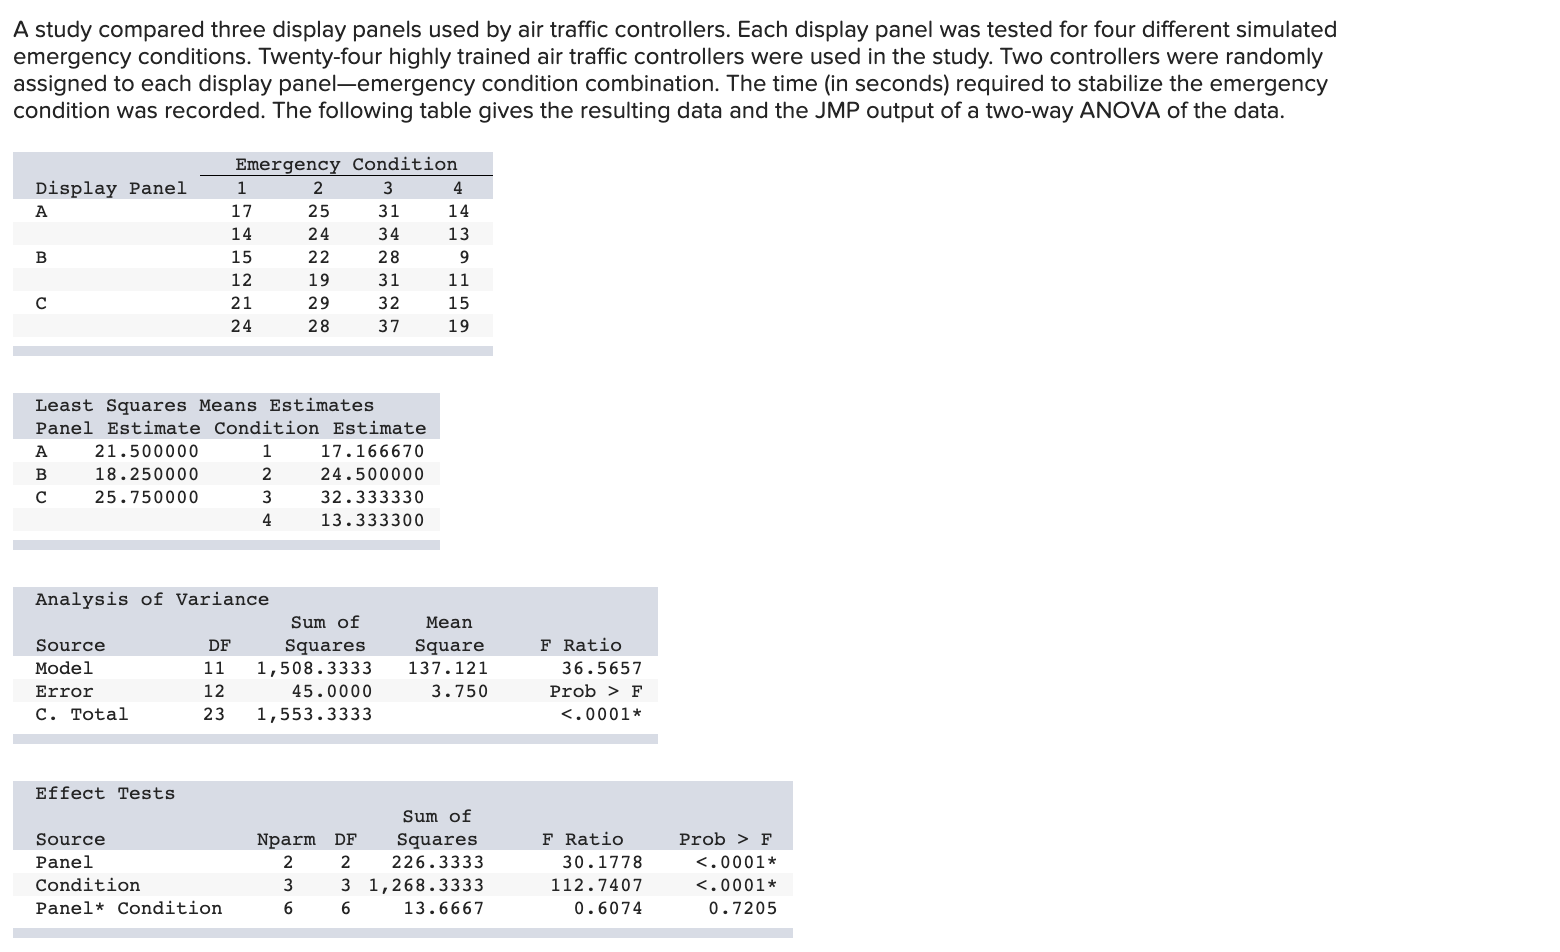
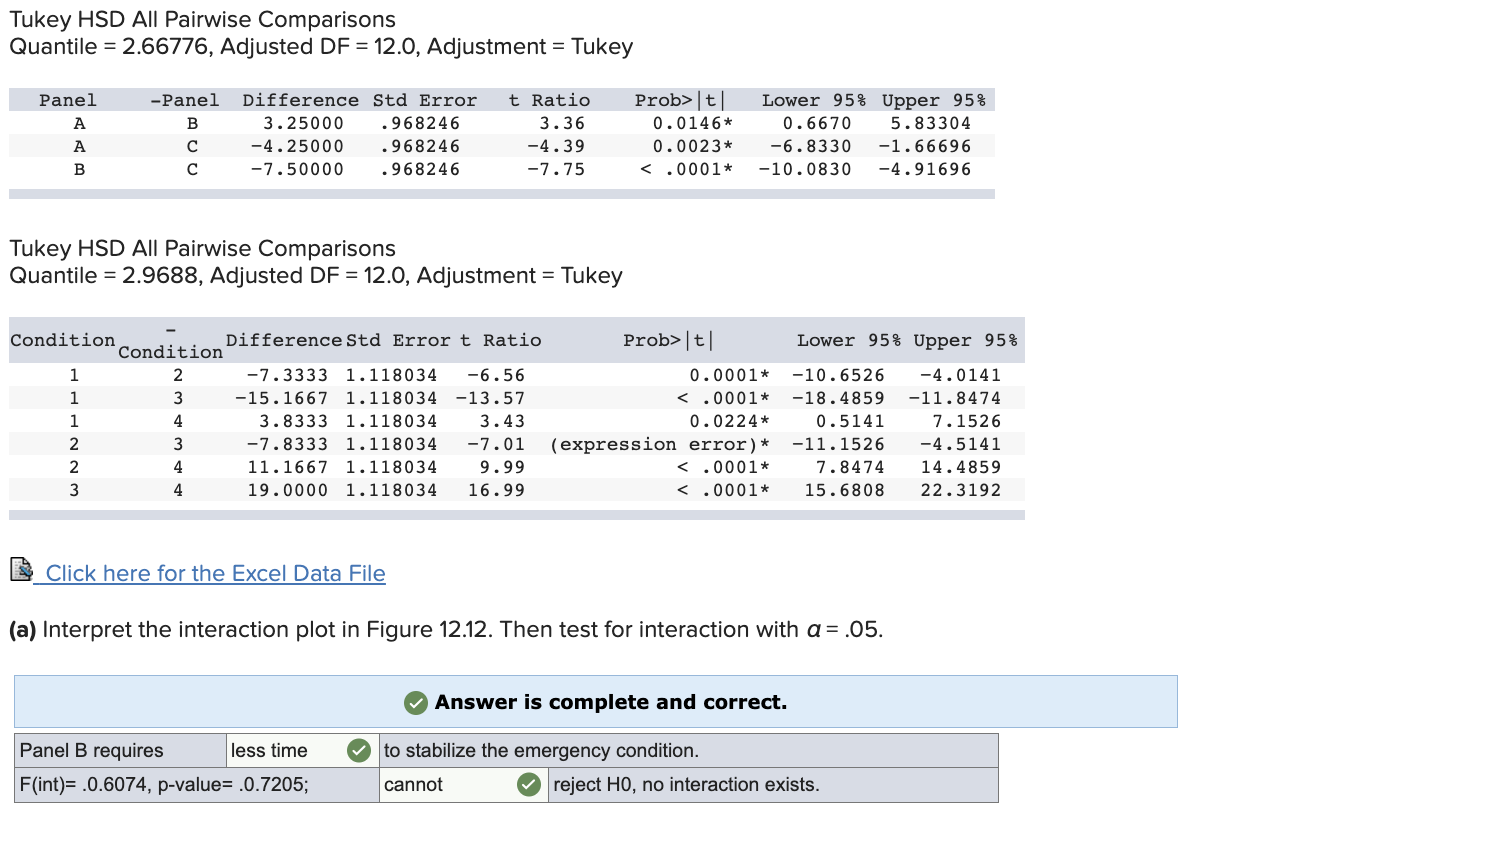
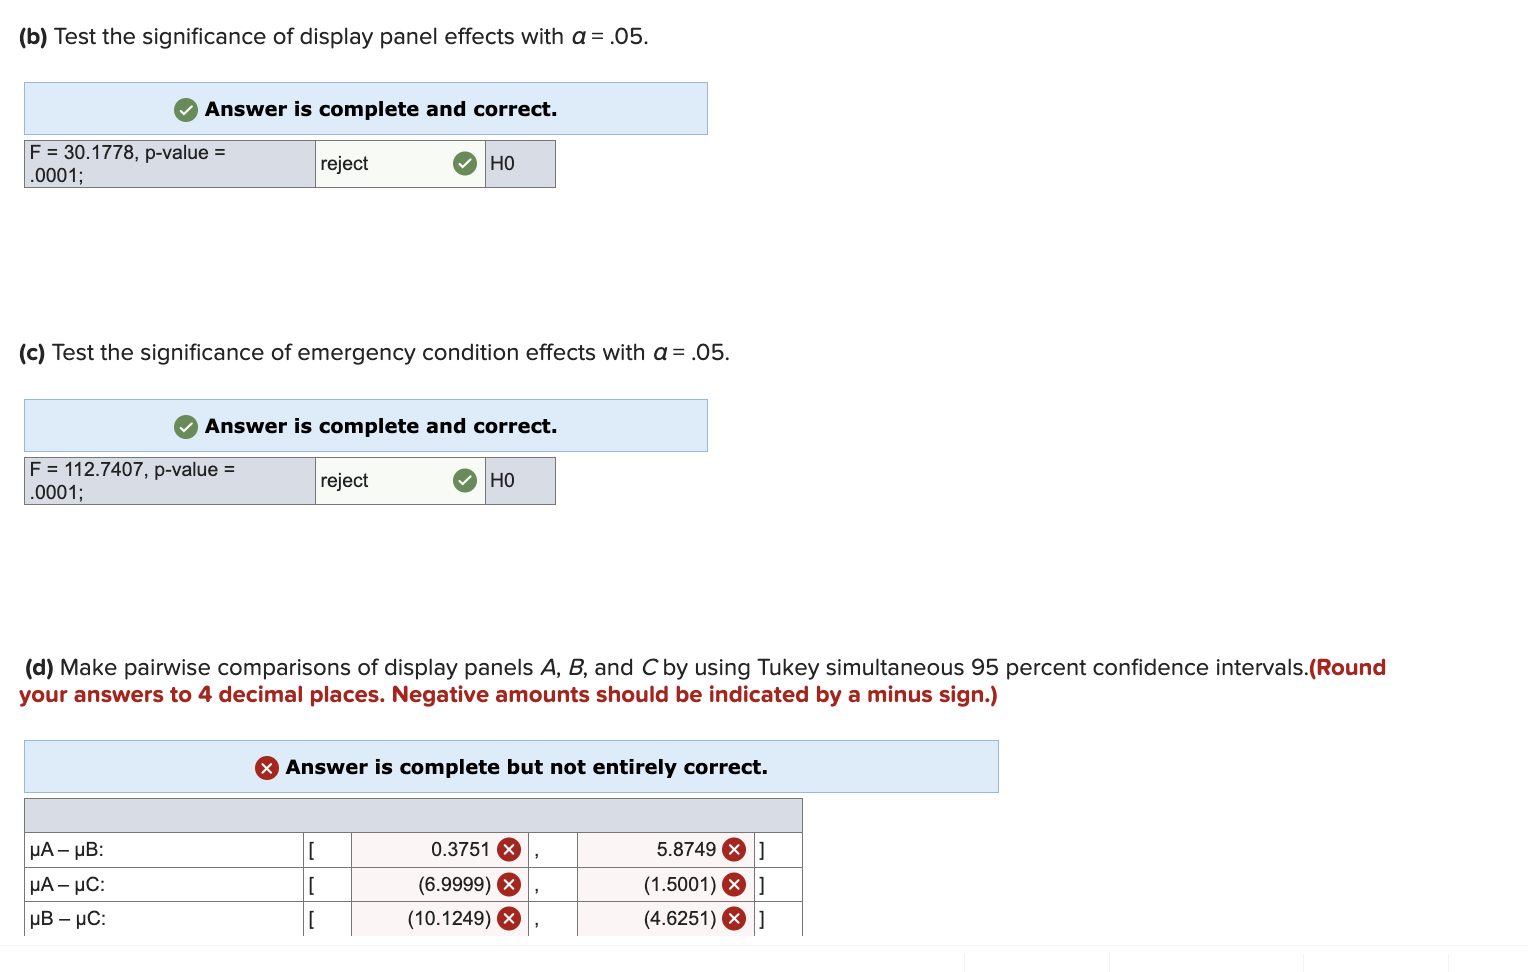
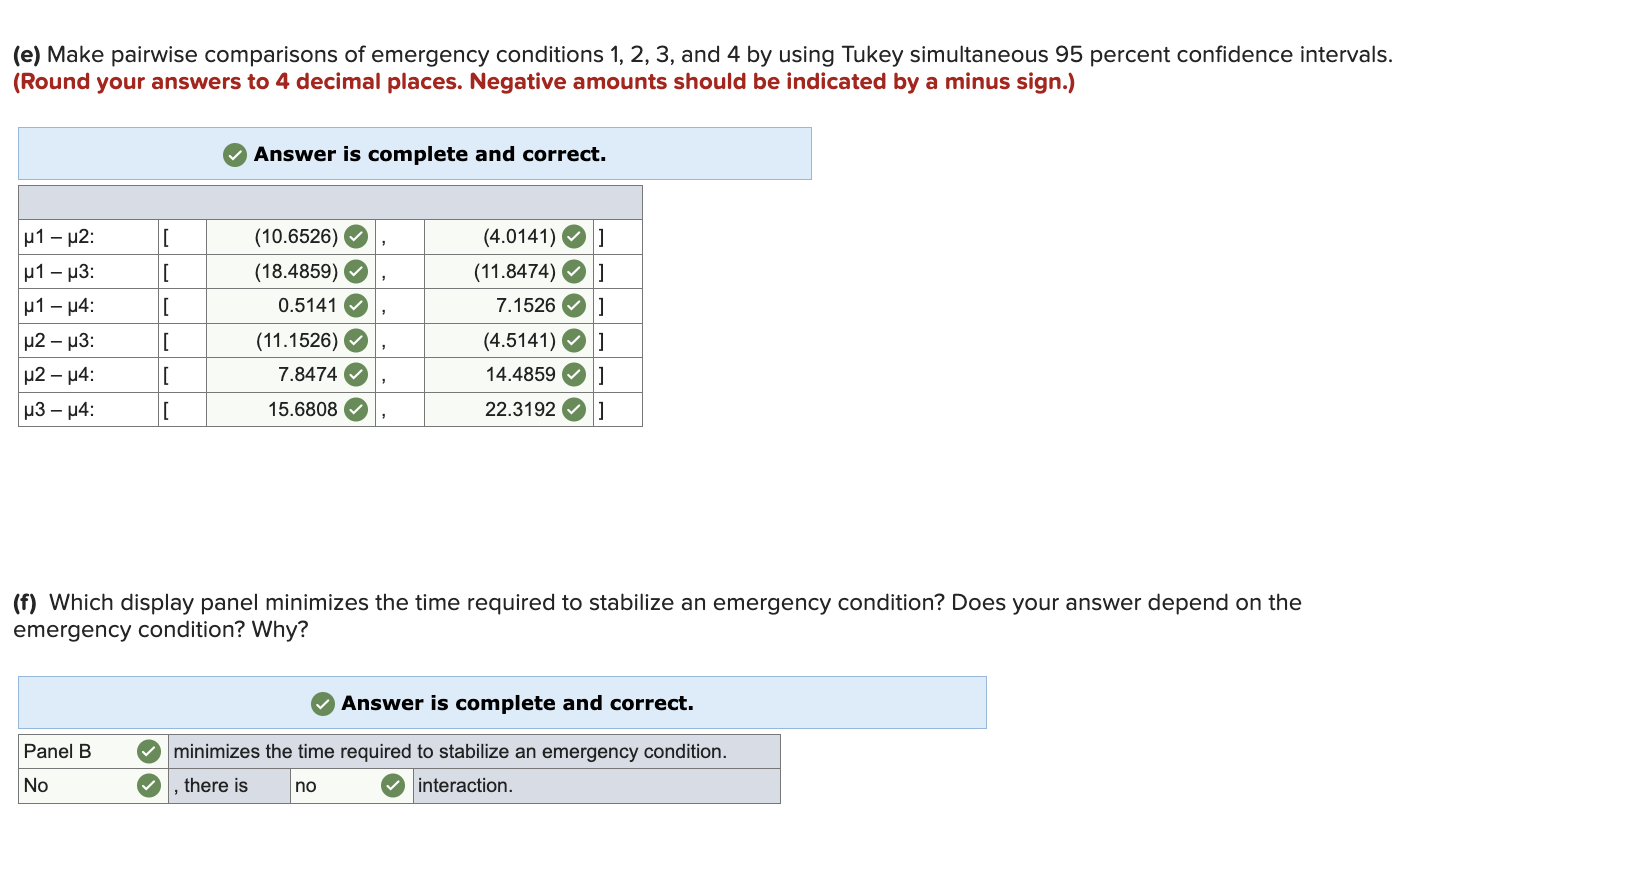
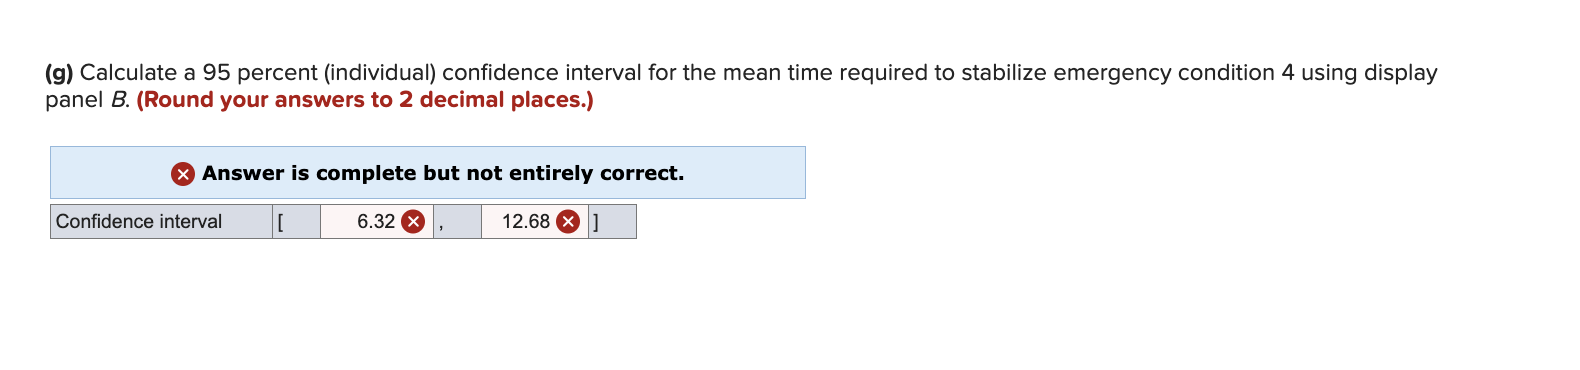
A study compared three display panels used by air traffic controllers. Each display panel was tested for four different simulated emergency conditions. Twenty-four highly trained air traffic controllers were used in the study. Two controllers were randomly assigned to each display panel-emergency condition combination. The time (in seconds) required to stabilize the emergency condition was recorded. The following table gives the resulting data and the JMP output of a two-way ANOVA of the data. Emergency Condition DA B 0 Display Panel 1 2 3 4 17 14 15 745 25 31 14 24 34 13 22 28 9 12 19 31 11 21 29 32 15 24 28 37 19 Least Squares Means Estimates Panel Estimate Condition Estimate ABC 21.500000 1 17.166670 18.250000 2 24.500000 25.750000 3 32.333330 4 13.333300 Analysis of Variance Sum of Source DF Squares Mean Square Model 11 1,508.3333 137.121 Error 12 45.0000 3.750 C. Total 23 1,553.3333 Effect Tests Sum of Source Nparm DF Panel 2 2 Condition 3 Squares 226.3333 3 1,268.3333 Panel Condition 6 6 13.6667 F Ratio 36.5657 Prob F Tukey HSD All Pairwise Comparisons Quantile = 2.66776, Adjusted DF 12.0, Adjustment = Tukey Difference Std Error t Ratio Panel A -Panel B 3.25000 .968246 3.36 A -4.25000 .968246 -4.39 Prob>|t| 0.0146* 0.0023* B -7.50000 .968246 -7.75 Lower 95% Upper 95% 0.6670 -6.8330 < .0001* -10.0830 5.83304 -1.66696 -4.91696 Tukey HSD All Pairwise Comparisons Quantile = 2.9688, Adjusted DF = 12.0, Adjustment = Tukey Condition Difference Std Error t Ratio Prob>|t| Condition 1 2 1 3 -7.3333 -15.1667 1.118034 -6.56 0.0001 Lower 95% Upper 95% -10.6526 -4.0141 1.118034 -13.57 1 4 3.8333 1.118034 2 3 -7.8333 1.118034 2 4 11.1667 1.118034 3 4 19.0000 1.118034 3.43 -7.01 9.99 16.99 < .0001* 0.0224* (expression error) * -18.4859 -11.8474 0.5141 7.1526 -11.1526 -4.5141 < .0001* < .0001* 7.8474 15.6808 14.4859 22.3192 Click here for the Excel Data File (a) Interpret the interaction plot in Figure 12.12. Then test for interaction with a=.05. Answer is complete and correct. Panel B requires less time to stabilize the emergency condition. F(int)= .0.6074, p-value= .0.7205; cannot reject HO, no interaction exists. (b) Test the significance of display panel effects with a = .05. Answer is complete and correct. F = 30.1778, p-value = .0001; reject HO (c) Test the significance of emergency condition effects with a = .05. Answer is complete and correct. F = 112.7407, p-value = .0001; reject HO (d) Make pairwise comparisons of display panels A, B, and C by using Tukey simultaneous 95 percent confidence intervals.(Round your answers to 4 decimal places. Negative amounts should be indicated by a minus sign.) A- B: A - C: HB UC: Answer is complete but not entirely correct. 0.3751 x (6.9999) X 5.8749] (1.5001)] (10.1249) x (4.6251)] (e) Make pairwise comparisons of emergency conditions 1, 2, 3, and 4 by using Tukey simultaneous 95 percent confidence intervals. (Round your answers to 4 decimal places. Negative amounts should be indicated by a minus sign.) Answer is complete and correct. 1-2: [ (10.6526) (4.0141) ] 1-3: [ (18.4859) u1-4: [ 0.5141 2-3: [ (11.1526) (11.8474) 7.1526 (4.5141) ] 2-4: 3-4: [ 7.8474 [ 15.6808 14.4859 22.3192 [] (f) Which display panel minimizes the time required to stabilize an emergency condition? Does your answer depend on the emergency condition? Why? Answer is complete and correct. Panel B minimizes the time required to stabilize an emergency condition. No there is no interaction. (g) Calculate a 95 percent (individual) confidence interval for the mean time required to stabilize emergency condition 4 using display panel B. (Round your answers to 2 decimal places.) Answer is complete but not entirely correct. Confidence interval [ 6.32 x 12.68]
Step by Step Solution
There are 3 Steps involved in it

Get step-by-step solutions from verified subject matter experts