

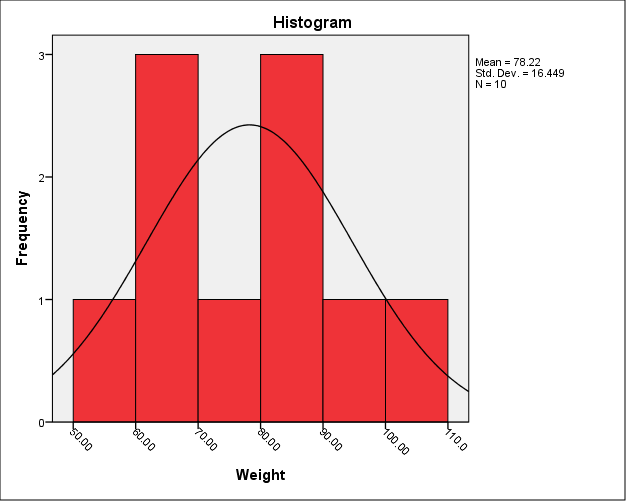
Question: A study was conducted by a QI group looking at weights of children in a pediatric clinic. The following bar chart was obtained. Write a
A study was conducted by a QI group looking at weights of children in a pediatric clinic. The following bar chart was obtained. Write a short summary statement describing this data.
Step by Step Solution
There are 3 Steps involved in it
1 Expert Approved Answer
Step: 1 Unlock

Question Has Been Solved by an Expert!
Get step-by-step solutions from verified subject matter experts
Step: 2 Unlock
Step: 3 Unlock