

Question: A study was conducted in a school on how students travel to school. Following are the data collected for three methods students use to
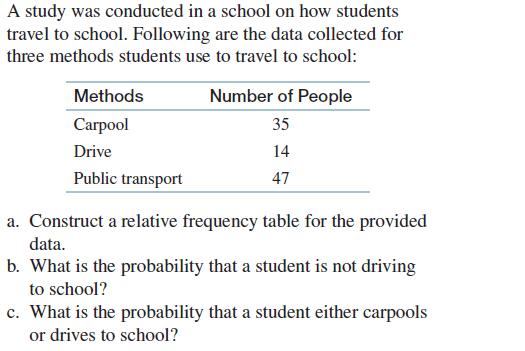
A study was conducted in a school on how students travel to school. Following are the data collected for three methods students use to travel to school: Methods Number of People Carpool 35 Drive 14 Public transport 47 a. Construct a relative frequency table for the provided data. b. What is the probability that a student is not driving to school? c. What is the probability that a student either carpools or drives to school?
Step by Step Solution
3.39 Rating (152 Votes )
There are 3 Steps involved in it
For the relative frequency we need to obtain the ... View full answer

Get step-by-step solutions from verified subject matter experts