

Question: A study was performed relating vegetable and fruit consumption to systolic blood pressure (SBP) in a group of 60 lactovegetarians (vegetarians who eat dairy products
A study was performed relating vegetable and fruit consumption to systolic blood pressure (SBP) in a group of 60 lactovegetarians (vegetarians who eat dairy products but not meat, poultry or fish). Variables age, sex, weight and fruit consumption are available for all in the group. Sex is coded 1 if male and 2 if female; the weight is recorded in pounds; and the fruit consumption reflects the number of servings of fruit per day.
A multiple linear regression model is fit to the data:
Systolic blood pressure = intercept +?1 x AGE +?2 x SEX +?3 x WEIGHT +?4 x FRUIT
The statistical output is given below:
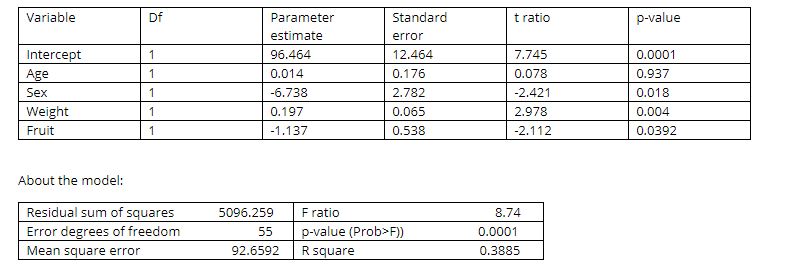
Variable Df Parameter Standard t ratio p-value estimate error Intercept 1 96.464 12.464 7.745 0.0001 Age 1 0.014 0.176 0.078 0.937 Sex 1 -6.738 2.782 -2.421 0.018 Weight 0.197 0.065 2.978 0.004 Fruit 1 -1.137 0.538 -2.112 0.0392 About the model: Residual sum of squares 5096.259 F ratio 8.74 Error degrees of freedom 55 p-value (Prob>F)) 0.0001 Mean square error 92.6592 R square 0.3885\fF= 0.3 r = 0.6 =09 FIGURE 2. The absolute magnitude of r is also a major determinant of To mitigate this problem, r is often recalculated substitut- statistical significance (the other being the number of observa- ing ranks for the raw data. (An r calculated using raw data is tions). Consider 20 observations as depicted above. An r of 0.3 (a called a Pearson r, while an r calculated using ranks is called a weak correlation) has an associated P value of 0.2. The P value Spearman r. A reported r should be assumed to be Pearson r falls with stronger correlations: P= 0.005 for an r of 0.6 and P
Step by Step Solution
There are 3 Steps involved in it

Get step-by-step solutions from verified subject matter experts