

Question: A subsurface profile for your site is shown in Figure 1 . To aid your supervisor, generate and plot profiles of total vertical stress, vertical
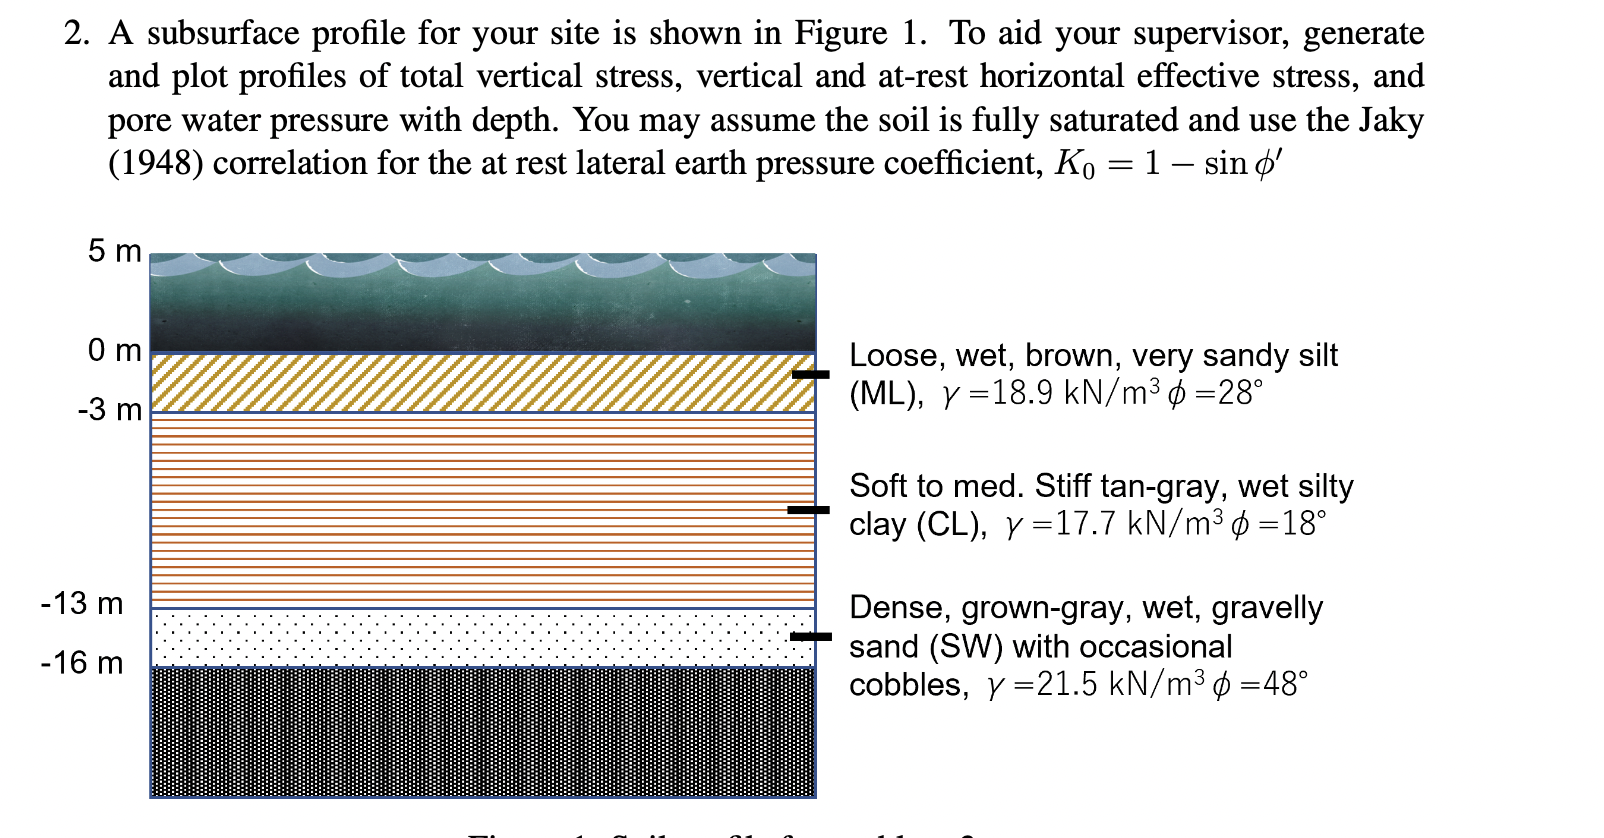
A subsurface profile for your site is shown in Figure To aid your supervisor, generate
and plot profiles of total vertical stress, vertical and atrest horizontal effective stress, and
pore water pressure with depth. You may assume the soil is fully saturated and use the Jaky
correlation for the at rest lateral earth pressure coefficient,
Loose, wet, brown, very sandy silt
ML
Soft to med. Stiff tangray, wet silty
clay CL
Dense, growngray, wet, gravelly
sand SW with occasional
cobbles,
Step by Step Solution
There are 3 Steps involved in it
1 Expert Approved Answer
Step: 1 Unlock

Question Has Been Solved by an Expert!
Get step-by-step solutions from verified subject matter experts
Step: 2 Unlock
Step: 3 Unlock