

Question: A survey designed to study how much households spend on eating out finds the following regression equation: Y hat =17.28+.354 Household Income. Y hat is
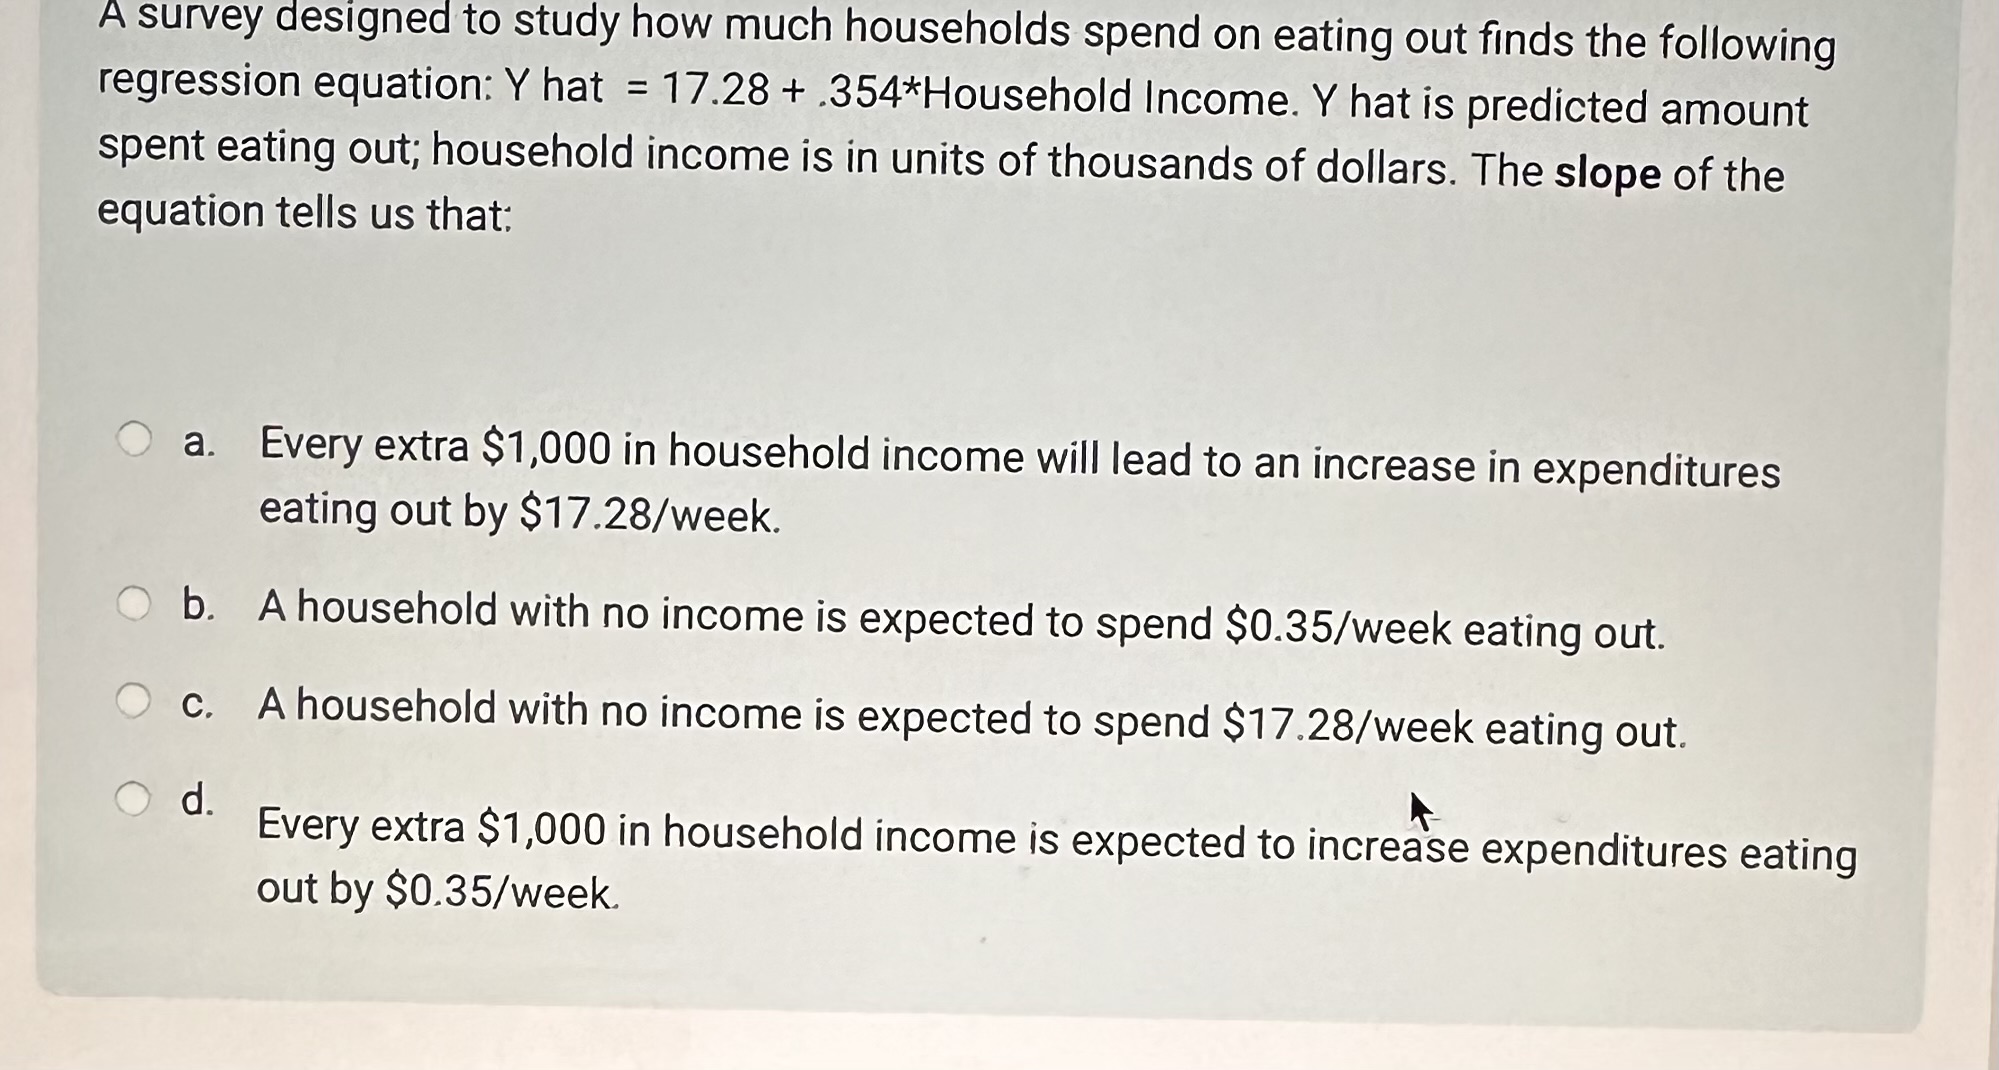
A survey designed to study how much households spend on eating out finds the following regression equation: Y hat =17.28+.354 Household Income. Y hat is predicted amount spent eating out; household income is in units of thousands of dollars. The slope of the equation tells us that: a. Every extra $1,000 in household income will lead to an increase in expenditures eating out by $17.28/ week. b. A household with no income is expected to spend $0.35/ week eating out. c. A household with no income is expected to spend $17.28/ week eating out. d. Every extra $1,000 in household income is expected to increase expenditures eating out by $0.35/ week
Step by Step Solution
There are 3 Steps involved in it
1 Expert Approved Answer
Step: 1 Unlock

Question Has Been Solved by an Expert!
Get step-by-step solutions from verified subject matter experts
Step: 2 Unlock
Step: 3 Unlock