A sustainable business and mission require effective planning and financial management. Ratio analysis is a useful management
Question:
A sustainable business and mission require effective planning and financial management. Ratio analysis is a useful management tool that will improve the understanding of financial results and trends over time, and provide key indicators of organisational performance. For instance, managers use ratio analysis to pinpoint strengths and weaknesses from which strategies and initiatives can be formed. Meanwhile, funders may use ratio analysis to measure results against other organisations or make judgments concerning management effectiveness and mission impact. There are many other users of financial statement that may find ratio analysis is crucial for them to decide on the company that they are interested in investing.
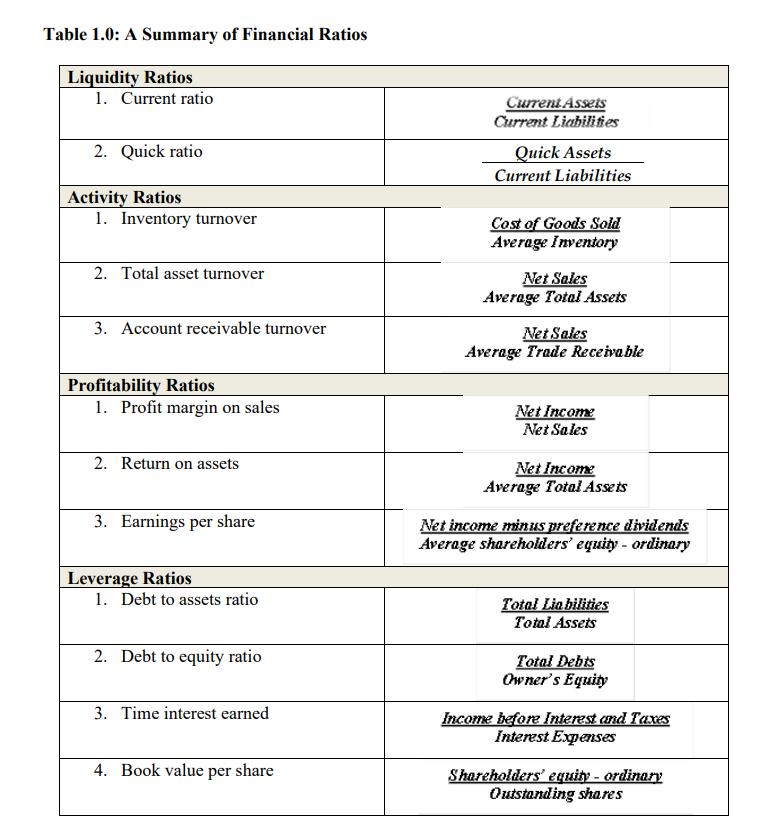
There are four major types of ratios; (i) liquidity ratios – to measure the company’s short term ability to pay its maturating obligations, (ii) activity ratios – to measure of how effective the company uses its assets, (iii) profitability ratios – to measure the degree of success or failure of a given company or division for a given period and (iv) leverage ratios – to measure the degree of protection for long term creditors and investor. This case is putting you in a senior consultant position with a given business scenario. The internal situation analysis usually requires financial analysis. Based on available financial information, you need to assess the firm’s financial performance, its strengths and weaknesses, and provide suggestions for future planning. A common approach is to calculate various ratios using major items from the firm’s financial position statement and profit or loss and comprehensive income statement. Ratio analysis is a powerful means to evaluate the firm’s financial position and help understand the overall picture of the firm. The financial analysis can be made on a historical basis and also by comparing similar firms in the industries. The former method is based on trend analysis to evaluate the firm’s present ratios in comparison with those of previous years to find the direction that the firm is moving forward and evaluate the effectiveness of its past strategy. The latter method is based on cross-sectional analysis to determine the firm’s performance relative to its major competitors and the industry average
REQUIRED: 1. Assume that you are in the position of senior consultant. You are required to prepare an interesting and comprehensive report for Client A and Client B. For that; the following information may help:
i. You are required to download the annual report of TWO Malaysian public listed companies (PLC) (i.e. Company X and Company Y) from the Main Market (http://www.bursamalaysia.com). Make sure both companies are from the same sector.
ii. Briefly describe the main business activity of the companies. Highlight the key performance of the companies, e.g. by total sales, total profit, total asset, total liabilities.
iii. Compute the ratios for both companies using the financial information presented on the company’s financial statement based on the list of ratios provided in Table 1.0. You also have to interpret the ratios. The interpretations of each ratios results are compulsory. The analysis and interpretation of the ratios can be made on a historical basis or trend analysis for at least three (3) recent years (i.e. 2018, 2019 and 2020).
iv. Assume that your company has assigned you a case in which a client (Client A), is interested to invest in the companies that you are working on (Company X). Advise your client by referring to the information (relevant ratios) that are important to be analysed on deciding whether or not to invest. Give your justifications and critical analysis based on the ratios that you have computed (trend analysis). To strengthen your justifications to Client A, provide comparison for each of the ratio between Company X and Company Y. Communicate your preference to Client A and justify your opinion. You may use cross-sectional analysis to determine the firm’s performance relative to its major competitors and the industry average (must be based on critical analysis).
v. Assume that your company also assign you to consult Client B regarding his concern whether or not to provide financial assistance to Company X and Company Y. Client B asks your help in assessing whether both companies able to pay or not its obligation in the future. Calculate the relevant ratios and give your justifications. You may carry out the ratio analysis using trend analysis, and to strengthen your justifications, you may use cross-sectional analysis to compare Company X with Company Y (for the relevant ratios).
Notes: i. The ratios provided in Table 1.0 are based on the items of Statement of Financial Position and Statement of Profit or Loss and Other Comprehensive Income (FAR 2 syllabus). You may use ratios for items of Cash Flow Statement if you considered it as necessary to explain your case.
ii. This analysis can be more effective if performed using Microsoft Excel to facilitate and simplify the work. For ratios computation, you are encouraged to use Microsoft Excel and create your formula using cells. Please show the formulas that you use by screenshot the formula page in your report. Thus, you do not have to perform double work for ratios 4 computation, and you can put aside your calculator. Please see the illustrations provided on the next page.
iii. Use your creativity to produce a comprehensive yet interesting report to your clients. You can prepare graphs or any type of illustrations which consider useful for the trend analysis. Never underestimate the impactful of visual presentation to amaze and convince your clients. (IT integrated skills).
Illustration for ratio computation using Microsoft Excel (the example is based on years 2014 vs. 2015)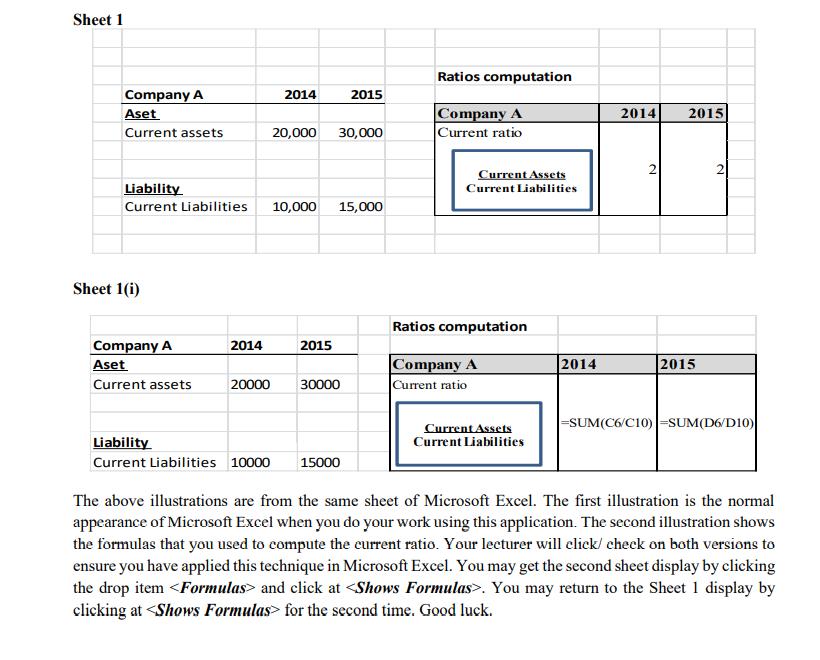
Expert Answer:
REQUIRED 1 Assume that you are in the position of senior consultant You are required to prepare an interesting and comprehensive report for Client A a... View the full answer