

Question: a) Table 2 below lists monthly total returns from January 2019 to December 2019 for CFR, SOL, NPN, MUR, SHP and APN which were computed
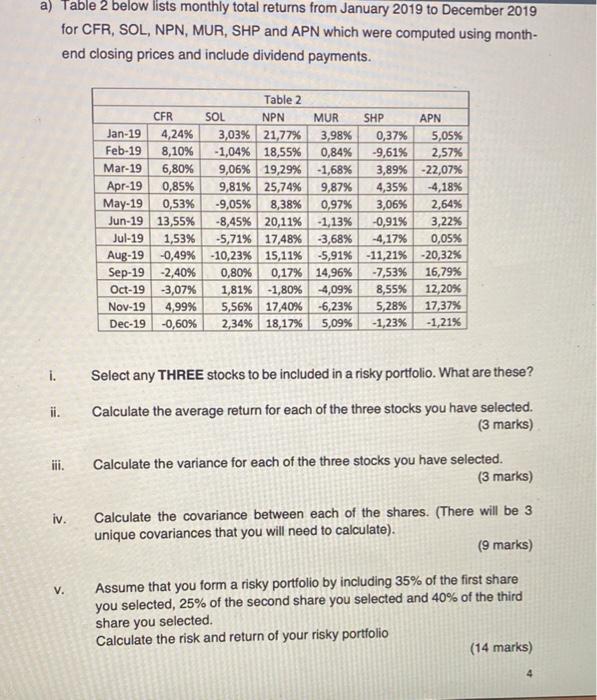
a) Table 2 below lists monthly total returns from January 2019 to December 2019 for CFR, SOL, NPN, MUR, SHP and APN which were computed using month- end closing prices and include dividend payments. Table 2 CFR SOL NPN MUR SHP APN Jan-19 4,24% 3,03% 21,77% 3,98% 0,37% 5,05% Feb-19 8,10% -1,04% 18,55% 0,84% -9,61% 2,57% Mar-19 6,80% 9,06% 19,29% -1,68% 3,89% -22,07% Apr-19 0,85% 9,81% 25,74% 9,87% 4,35% -4,18% May-19 0,53% -9,05% 8,38% 0,97% 3,06% 2,64% Jun-19 13,55% -8,45% 20,11% -1,13% -0,91% 3,22% Jul-19 1,53% -5,71% 17,48% -3,68% -4,17% 0,05% Aug-19 -0,49% -10,23% 15,11% -5,91% -11,21% -20,32% Sep-19 -2,40% 0,80% 0,17% 14,96% -7,53% 16,79% Oct-19 -3,07% 1,81% -1,80% -4,09% 8,55% 12,20% Nov-19 4,99% 5,56% 17,40% -6,23% 5,28% 17,37% Dec-19 -0,60% 2,34% 18,17% 5,09% -1,23% -1,21% i. Select any THREE stocks to be included in a risky portfolio. What are these? ii. Calculate the average return for each of the three stocks you have selected. (3 marks) Calculate the variance for each of the three stocks you have selected. (3 marks) iii. iv. Calculate the covariance between each of the shares. (There will be 3 unique covariances that you will need to calculate). (9 marks) V. Assume that you form a risky portfolio by including 35% of the first share you selected, 25% of the second share you selected and 40% of the third share you selected. Calculate the risk and return of your risky portfolio (14 marks) 4
Step by Step Solution
There are 3 Steps involved in it

Get step-by-step solutions from verified subject matter experts