

Question: A table of values for a linear functions are shown. x f(x) -1 -8 36 6 0 96 Select the bubbles that match the
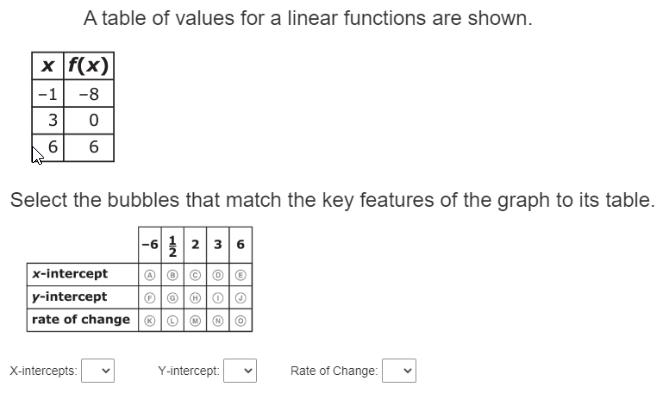
A table of values for a linear functions are shown. x f(x) -1 -8 36 6 0 96 Select the bubbles that match the key features of the graph to its table. X-intercepts: x-intercept y-intercept rate of change 9 @ O HIN @ 9 O 236 O O O 3 Y-intercept: Q Rate of Change:
Step by Step Solution
There are 3 Steps involved in it
1 Expert Approved Answer
Step: 1 Unlock

1 T 4 3 6 Analysis 2 fx 8 0 Critical key features of the graph sketch AYC 6 0 21 4 ... View full answer
Question Has Been Solved by an Expert!
Get step-by-step solutions from verified subject matter experts
Step: 2 Unlock
Step: 3 Unlock