

Question: A telescope was designed to study a neutron star in the Crab Nebula and a black hole in Cygnus X-t. On July 18th, the telescope
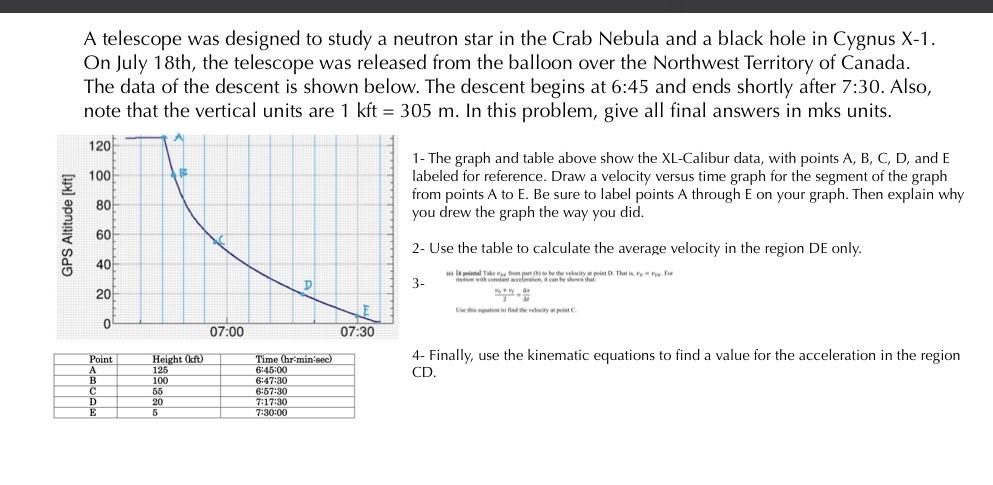
A telescope was designed to study a neutron star in the Crab Nebula and a black hole in Cygnus X-t. On July 18th, the telescope was released from the balloon over the Northwest Territory of Canada. The data of the descent is shown below. The descent begins at 6:45 and ends shortly after 7:30. Also, note that the vertical units are t kft = 305 m. In this problem, give all final answers in mks units. 1- The graph and table above show the XL-Calihur data, with points A. B. (I. D, and E labeled for reference. Draw a velocity versus time graph for the segment of the graph from pointsA to E. Be sure to label points A through E on your graph.Then explain why you drew the graph the way you did. 2- Use the table to calculate the average velocity in the region DE only. .........._.. .l.._._._-_l ._._...._....._. GPS Altitude [m] \\- I.-.|.hvm-.-'||i.mu. I.. I" ... .......| | .t. .. .. .. ...-..-.w-i... 3_ .1 4- Finally. use the kinematic equations to find a value for the acceleration in the region CD
Step by Step Solution
There are 3 Steps involved in it

Get step-by-step solutions from verified subject matter experts