

Question: A tension test was done on two different specimens. The test results are shown below. Calculate the values for stress and strain, and graph the
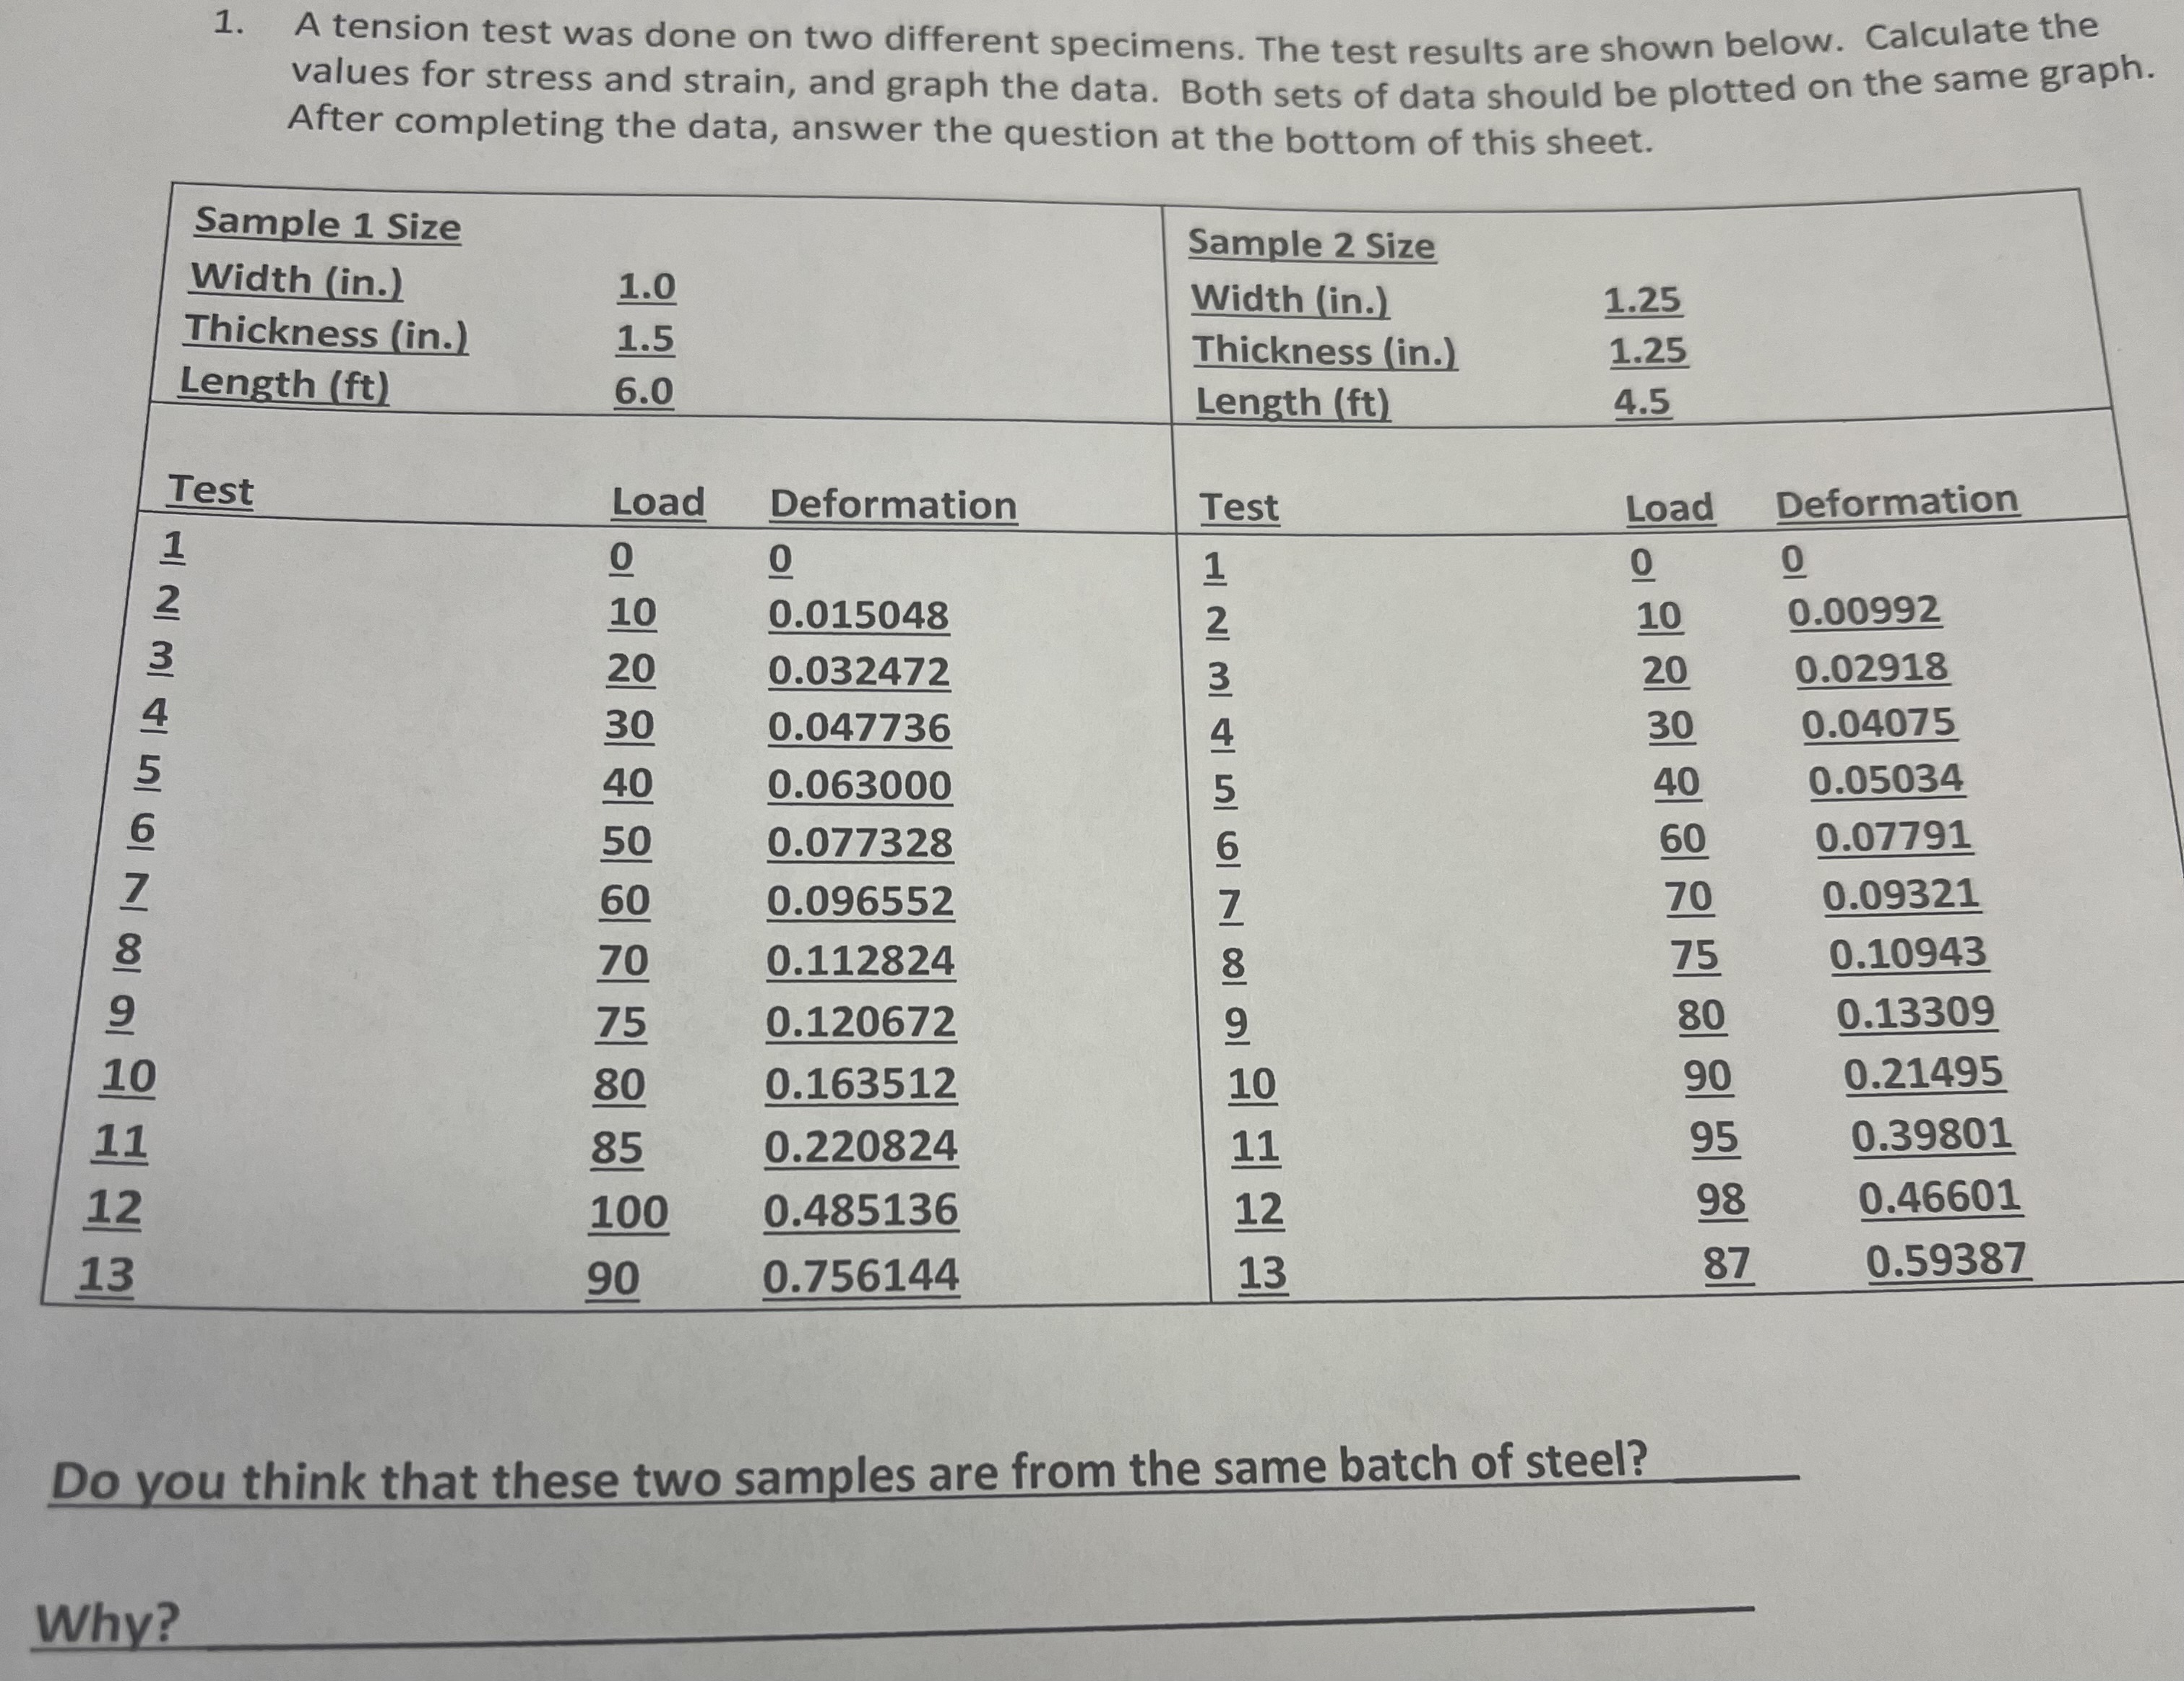
A tension test was done on two different specimens. The test results are shown below. Calculate the
values for stress and strain, and graph the data. Both sets of data should be plotted on the same graph.
After completing the data, answer the question at the bottom of this sheet.
Do you think that these two samples are from the same batch of steel?
Why?
Step by Step Solution
There are 3 Steps involved in it
1 Expert Approved Answer
Step: 1 Unlock

Question Has Been Solved by an Expert!
Get step-by-step solutions from verified subject matter experts
Step: 2 Unlock
Step: 3 Unlock