

Question: A textbook publishing company has compiled data on total annual sales of its business textbooks for the preceding elght years: o-1. Select the correct data
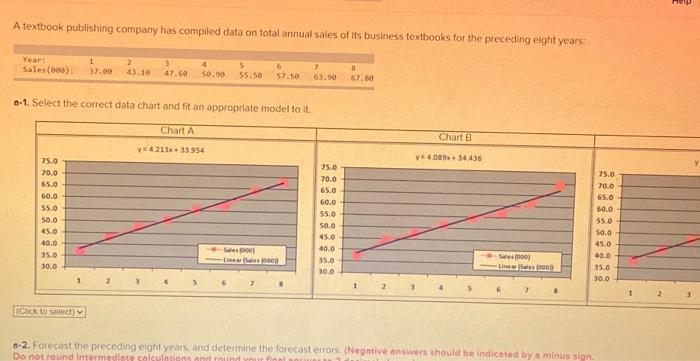
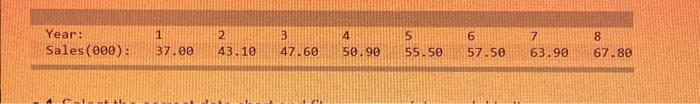
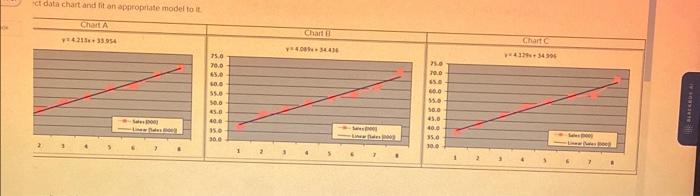
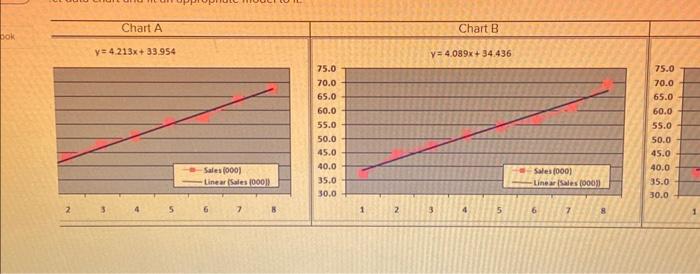
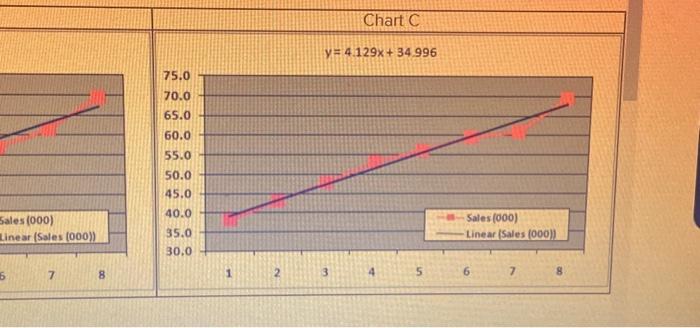
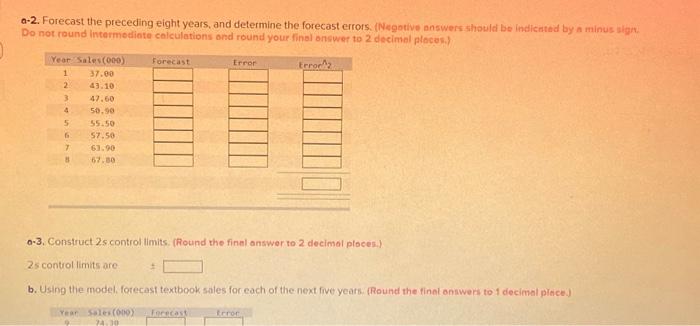
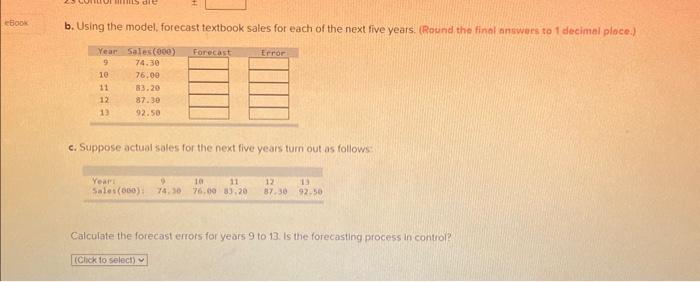
A textbook publishing company has compiled data on total annual sales of its business textbooks for the preceding elght years: o-1. Select the correct data chart and fit an appropriate model to it. a-2. Forecast the preceding eight years, and determine the forecast errors. (Negotive answers should be indicatad by a minus ulgne. Do not round intermediote calculations ond round your finsl onswer to 2 decimal ploces. 0.3. Construct 2 s control limits. (Round the finel answer to 2 decimal ploces.) 2 s control limits are b. Using the model, fotecast textbook sales for each of the next five years. (Round the final answers to 1 decimal pince.) \begin{tabular}{|l|l|l|l|l|l|l|l|l|} \hline Year: & 1 & 2 & 3 & 4 & 5 & 6 & 7 & 8 \\ Sales (00): & 37.00 & 43.10 & 47.60 & 50.90 & 55.50 & 57.50 & 63.90 & 67.80 \\ \hline \end{tabular} b. Using the model, forecast textbook sales for each of the next five years. (Round the finel answars to 1 decimal ploce.) c. Suppose actual sales for the next five years turn out as follows: Calculate the forecast errors for years 9 to 13. Is the forecasting process in control? Ctdota chart and fit an appropitate model to it
Step by Step Solution
There are 3 Steps involved in it

Get step-by-step solutions from verified subject matter experts