

Question: a= The optimistic completion time estimate. m= The most likely completion time. b= The pessimistic completion time. An activity's completion time variance is Time in
a= The optimistic completion time estimate.
m= The most likely completion time.
b= The pessimistic completion time.
An activity's completion time variance is

Time in hours
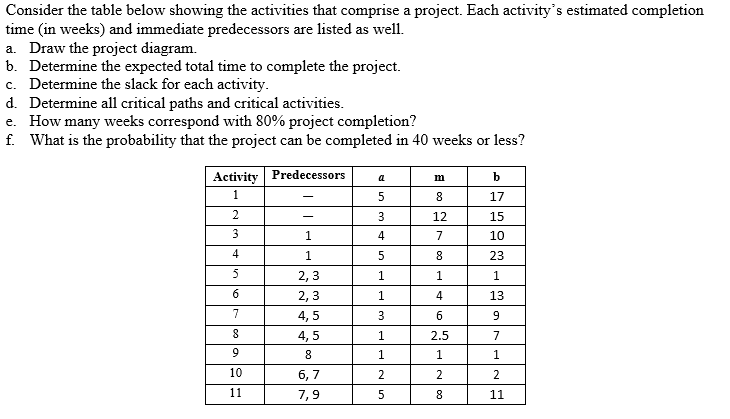
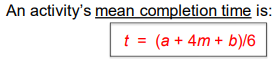
Consider the table below showing the activities that comprise a project. Each activity's estimated completion time (in weeks) and immediate predecessors are listed as well. a. Draw the project diagram. b. Determine the expected total time to complete the project. C. Determine the slack for each activity. d. Determine all critical paths and critical activities. e. How many weeks correspond with 80% project completion? f. What is the probability that the project can be completed in 40 weeks or less? Activity Predecessors b m 8 1 5 17 15 2 3 12 7 3 1 4 10 4 1 5 8 23 5 1 1 1 6 1 4 13 7 3 6 9 8 2,3 2,3 4,5 4,5 8 6,7 7,9 1 7 2.5 1 9 1 1 10 2 2 2 11 5 8 11 An activity's mean completion time is: t = (a + 4m + b)/6 02 = ((b-a)/6)2Step by Step Solution
There are 3 Steps involved in it
1 Expert Approved Answer
Step: 1 Unlock

Question Has Been Solved by an Expert!
Get step-by-step solutions from verified subject matter experts
Step: 2 Unlock
Step: 3 Unlock