

Question: Number of Workers Output 1 150 2 275 3 375 4 450 5 500 Refer to the table. Assume that fixed costs are $5,000,
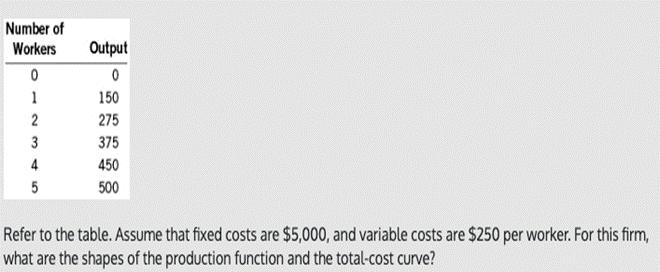
Number of Workers Output 1 150 2 275 3 375 4 450 5 500 Refer to the table. Assume that fixed costs are $5,000, and variable costs are $250 per worker. For this firm, what are the shapes of the production function and the total-cost curve? Cost Figure A Cost Figure B Quantity Quantity Cost Cost Figure C Figure D Quantity Quantity Refer to the Figure. Which of the figures represents the marginal-cost curve for a typical firm? AO Figure B BO Figure C CO Figure A DO Figure D Cost D B A Quantity Refer to the Figure. Which curve is most likely to represent marginal cost? AO Curve C BO Curve A CO Curve D DO Curve B Output 200 180 160 140 120 100 80 60 40 20 0 12 3 45 6 7 8 Workers Refer to the Figure. The graph illustrates the firm's production function. Based on its shape, what does the coresponding total-cost curve look like? AO ahorizontal straight line BO an upward-sloping curve that increases at a constant rate CO an upward-sloping curve that increases at an increasing rate DO an upward-sloping curve that increases at a decreasing rate Number of Workers Output 1 150 2 275 3 375 4 450 5 500 Refer to the table. Assume that fixed costs are $5,000, and variable costs are $250 per worker. For this firm, what are the shapes of the production function and the total-cost curve? Cost Figure A Cost Figure B Quantity Quantity Cost Cost Figure C Figure D Quantity Quantity Refer to the Figure. Which of the figures represents the marginal-cost curve for a typical firm? AO Figure B BO Figure C CO Figure A DO Figure D Cost D B A Quantity Refer to the Figure. Which curve is most likely to represent marginal cost? AO Curve C BO Curve A CO Curve D DO Curve B Output 200 180 160 140 120 100 80 60 40 20 0 12 3 45 6 7 8 Workers Refer to the Figure. The graph illustrates the firm's production function. Based on its shape, what does the coresponding total-cost curve look like? AO ahorizontal straight line BO an upward-sloping curve that increases at a constant rate CO an upward-sloping curve that increases at an increasing rate DO an upward-sloping curve that increases at a decreasing rate
Step by Step Solution
3.48 Rating (148 Votes )
There are 3 Steps involved in it
Answer 1 Answer A The production function is increasing at a decreasing rate whereas the totalcost f... View full answer

Get step-by-step solutions from verified subject matter experts