

Question: a.) The square function in MATLAB produces a square wave that repeats every 2* Pl. Create a vector t that goes from -0.5 to 0.499
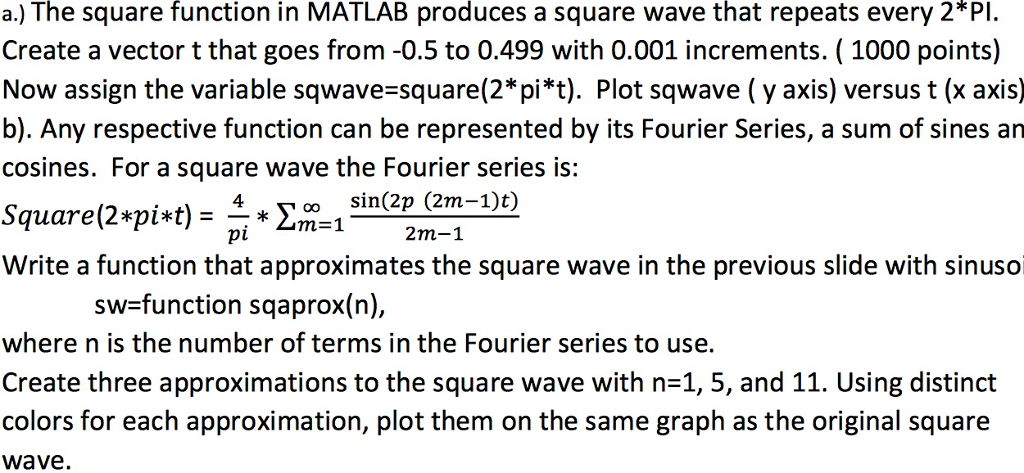
a.) The square function in MATLAB produces a square wave that repeats every 2* Pl. Create a vector t that goes from -0.5 to 0.499 with 0.001 increments. 1000 points) Now assign the variable sqwave-square(2* pi*t). Plot sqwave ( y axis) versus t (x axis) b). Any respective function can be represented by its Fourier Series, a sum of sines an cosines. For a square wave the Fourier series is: Square(2*pist)- * Write a function that approximates the square wave in the previous slide with sinuso sin(2p (2m-1)t) 00 pi sw function sqaprox(n), where n is the number of terms in the Fourier series to use. Create three approximations to the square wave with n-1, 5, and 11. Using distinct colors for each approximation, plot them on the same graph as the original square wave
Step by Step Solution
There are 3 Steps involved in it

Get step-by-step solutions from verified subject matter experts