

Question: a. The two figures depict the stocks security characteristic lines (SCL). Stock A has a higher firm-specific risk because the deviations of the observations from
a. The two figures depict the stocks’ security characteristic lines (SCL). Stock A has a higher firm-specific risk because the deviations of the observations from the SCL are larger for Stock A than for Stock B. Deviations are measured by the vertical distance of each observation from the SCL.
Consider the following two regression lines for stocks A and B in the following figure.
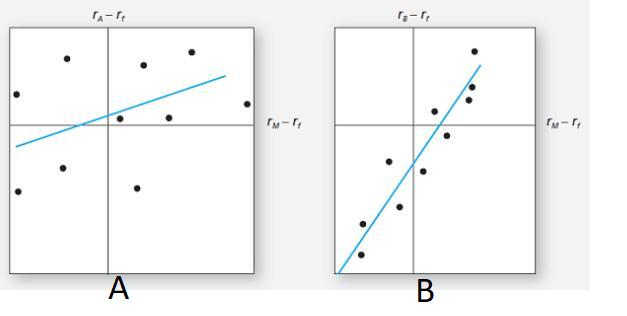
b. Beta is the slope of the SCL, which is the measure of systematic risk. The SCL for Stock B is steeper; hence Stock B’s systematic risk is greater.
c. The R 2 (or squared correlation coefficient) of the SCL is the ratio of the explained variance of the stock’s return to the total variance, and the total variance is the sum of the explained variance plus the unexplained variance (the stock’s residual variance):
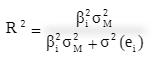
Since the explained variance for Stock B is greater than for Stock A (the explained variance is β 2 B σ M 2, which is greater since its beta is higher), and its residual variance σ 2 (e B ) is smaller, its R 2 is higher than Stock A’s.
d. Alpha is the intercept of the SCL with the expected return axis. Stock A has a small positive alpha whereas Stock B has a negative alpha; hence, Stock A’s alpha is larger.
e. The correlation coefficient is simply the square root of R 2, so Stock B’s correlation with the market is higher.
- A B
Step by Step Solution
3.46 Rating (156 Votes )
There are 3 Steps involved in it
Lets break down the points regarding Stocks A and B as described a FirmSpecific Risk Stock A has hig... View full answer

Get step-by-step solutions from verified subject matter experts