

Question: a) The UVVIS analysis showed possible interferences from other components in the tonic water. Was this also a problem on the fluorometer? Use the data
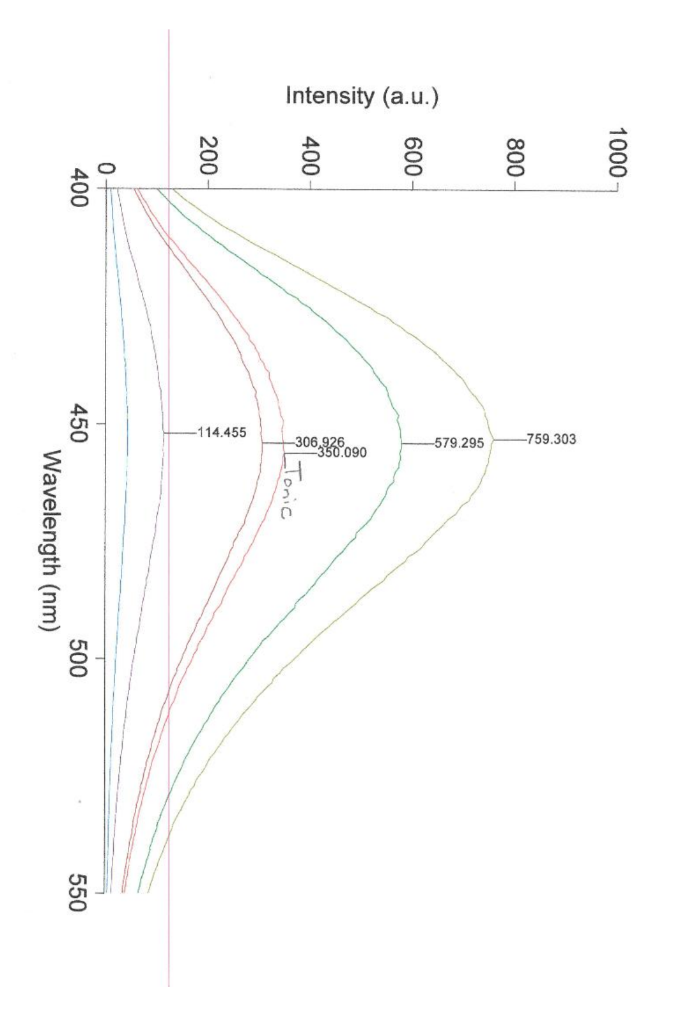
a) The UVVIS analysis showed possible interferences from other components in the tonic water. Was this also a problem on the fluorometer? Use the data to support your conclusions.
b) If your answer in part a was that there was no interference, explain why the components do not interfere in the same way they did on the UVVIS spectrometer.
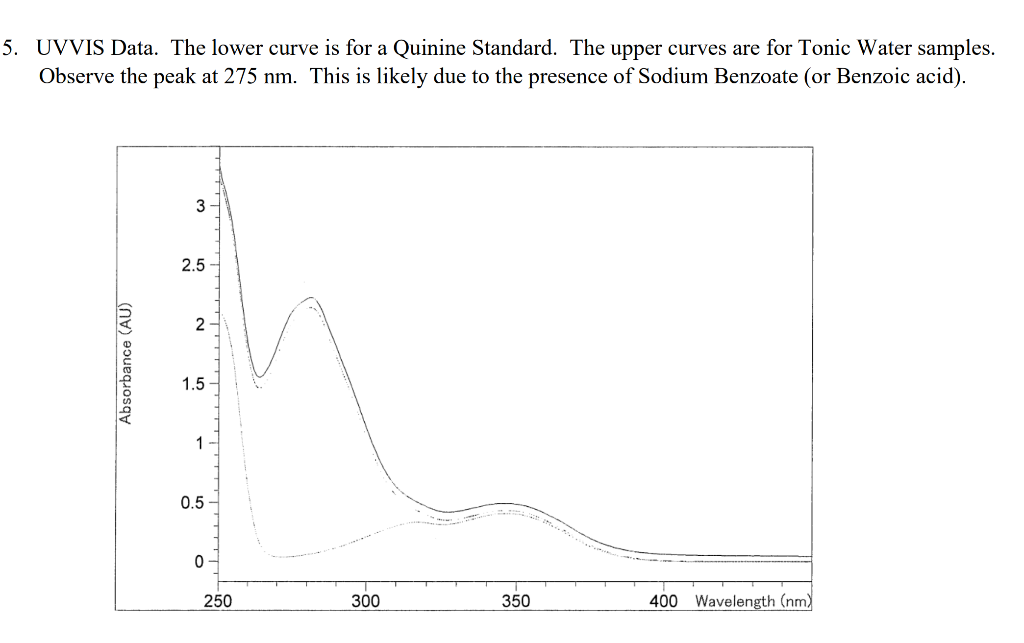
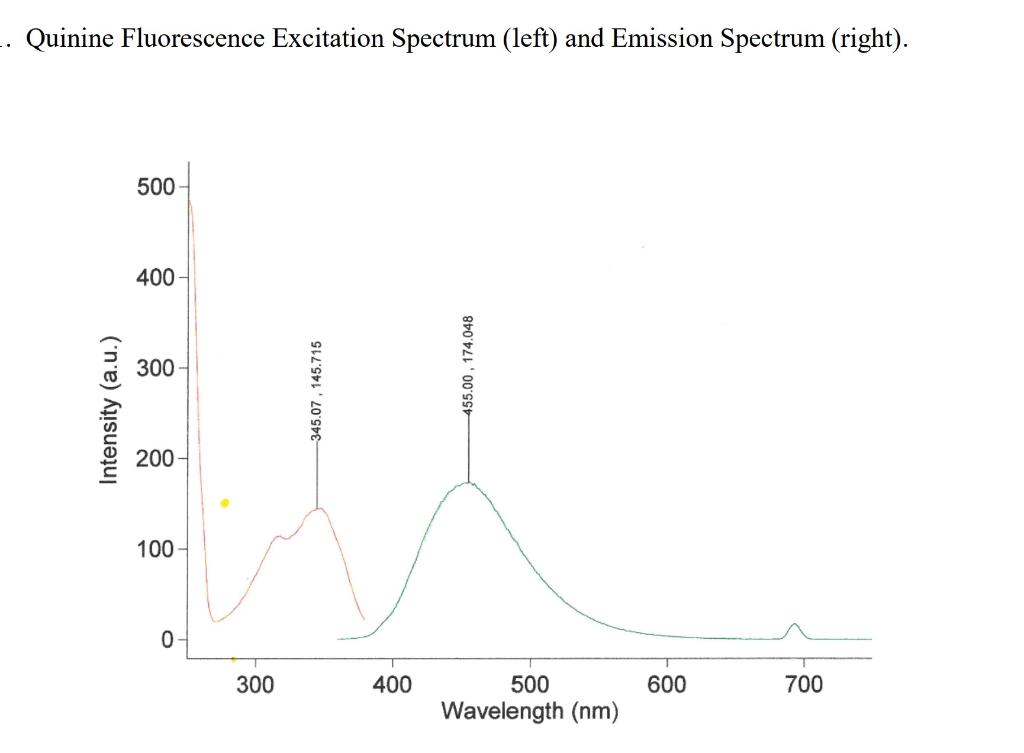
UVVIS Data. The lower curve is for a Quinine Standard. The upper curves are for Tonic Water samples. Observe the peak at 275nm. This is likely due to the presence of Sodium Benzoate (or Benzoic acid). Quinine Fluorescence Excitation Spectrum (left) and Emission Spectrum (right)
Step by Step Solution
There are 3 Steps involved in it
1 Expert Approved Answer
Step: 1 Unlock

Question Has Been Solved by an Expert!
Get step-by-step solutions from verified subject matter experts
Step: 2 Unlock
Step: 3 Unlock