

Question: A three-year ratio trend analysis is the minimum expectation. The following ratio categories must be included, with three ratios (minimum) from each category: Short-term solvency
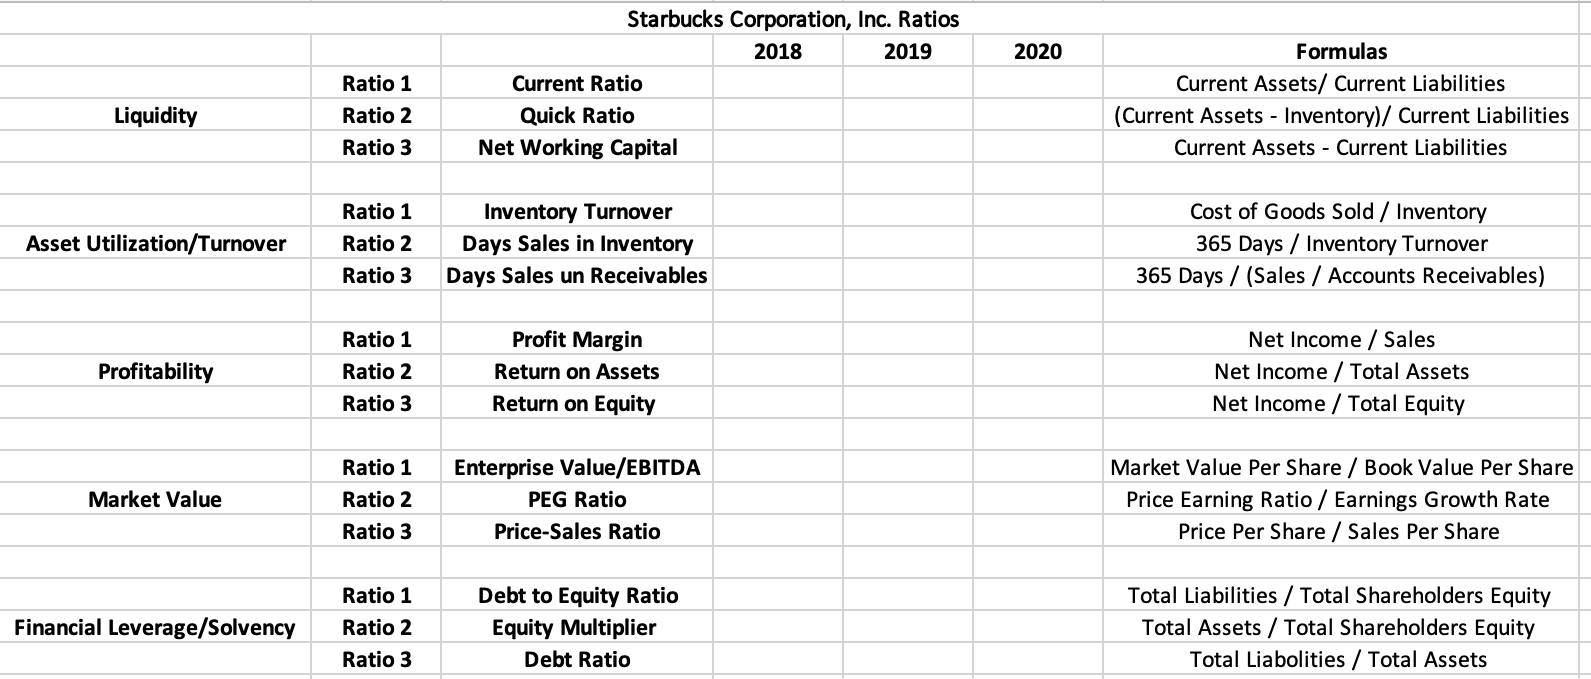
A three-year ratio trend analysis is the minimum expectation. The following ratio categories must be included, with three ratios (minimum) from each category:
- Short-term solvency ratios, also known as liquidity ratios
- Long-term solvency ratios, also known as financial leverage ratios
- Asset management ratios, also known as turnover ratios
- Profitability ratios
- Market value ratios.
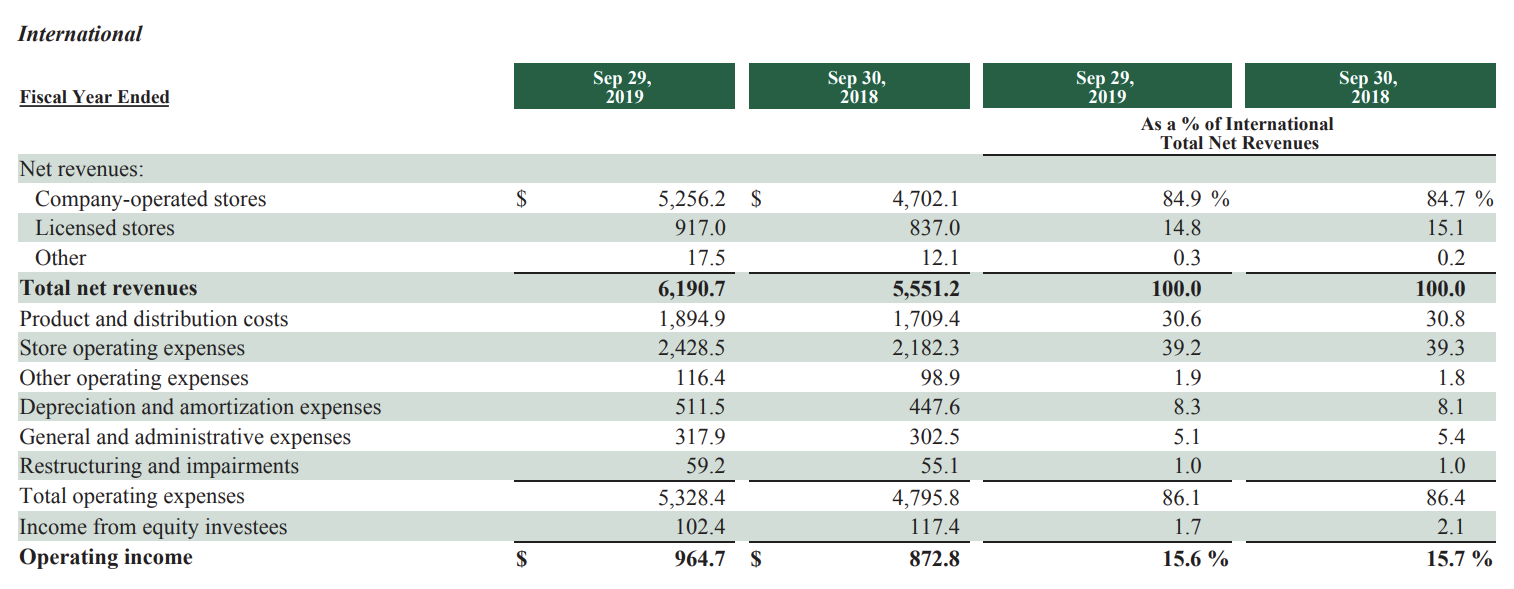
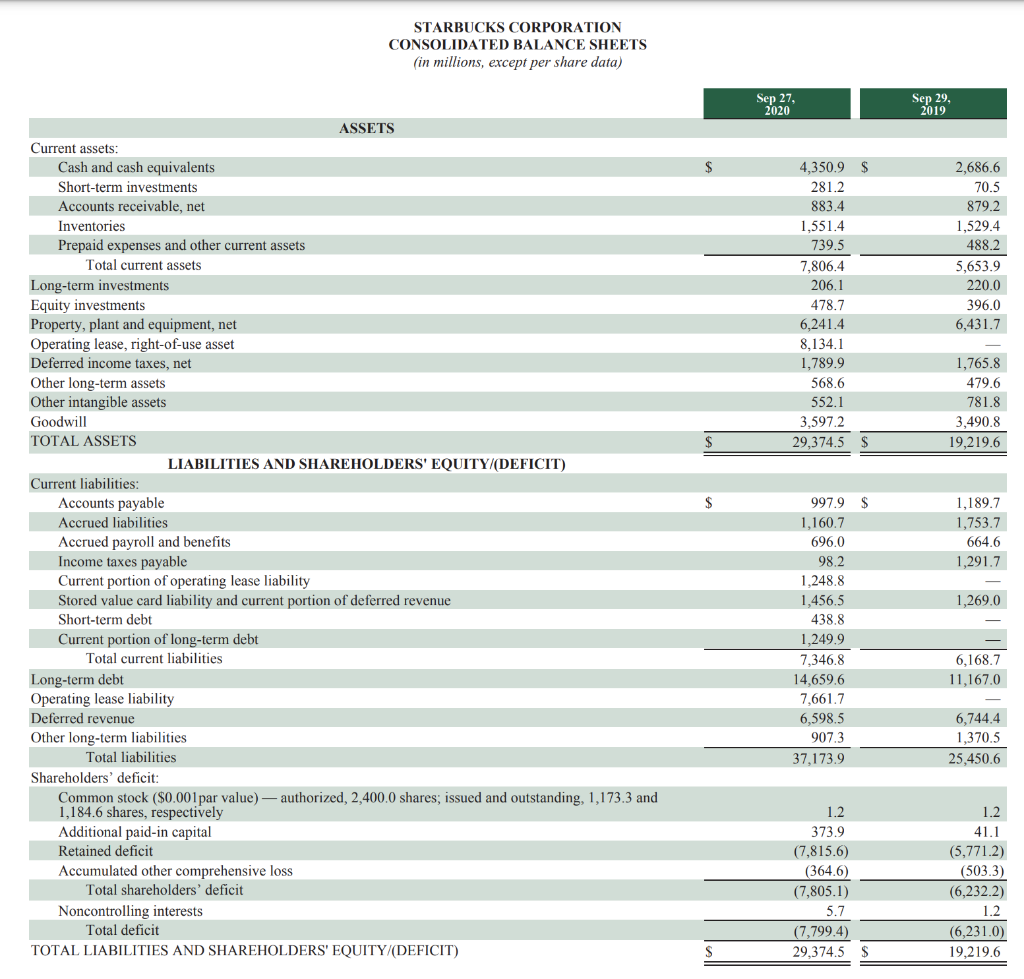
International Sep 29, 2019 Sep 30, 2018 Fiscal Year Ended Sep 29, 2019 Sep 30, 2018 As a % of International Total Net Revenues Net revenues: Company-operated stores Licensed stores $ 84.9 % 84.7 % 5,256.2 $ 917.0 4,702.1 837.0 14.8 15.1 Other 17.5 12.1 0.3 0.2 Total net revenues 100.0 100.0 30.6 30.8 6,190.7 1,894.9 2,428.5 116.4 5,551.2 1,709.4 2,182.3 98.9 39.2 39.3 1.9 1.8 511.5 447.6 8.3 8.1 Product and distribution costs Store operating expenses Other operating expenses Depreciation and amortization expenses General and administrative expenses Restructuring and impairments Total operating expenses Income from equity investees Operating income 317.9 302.5 5.1 5.4 59.2 55.1 1.0 1.0 86.1 86.4 5,328.4 102.4 4,795.8 117.4 1.7 2.1 $ 964.7 $ 872.8 15.6 % 15.7 % STARBUCKS CORPORATION CONSOLIDATED BALANCE SHEETS (in millions, except per share data) Sep 27, 2020 Sep 29, 2019 ASSETS S 2,686.6 70.5 879.2 4,350.9 281.2 883.4 1,551.4 739.5 7.806.4 206.1 1,529.4 488.2 Current assets: Cash and cash equivalents Short-term investments Accounts receivable, net Inventories Prepaid expenses and other current assets Total current assets Long-term investments Equity investments Property, plant and equipment, net Operating lease, right-of-use asset Deferred income taxes, net Other long-term assets Other intangible assets Goodwill TOTAL ASSETS 5,653.9 220.0 396.0 6,431.7 478.7 6,241.4 8,134.1 1,789.9 568.6 552.1 3,597.2 29,374.5 1,765.8 479.6 781.8 3,490.8 19,219.6 $ 997.9 S 1,160.7 696,0 1,189.7 1,753.7 664.6 98.2 1,291.7 LIABILITIES AND SHAREHOLDERS' EQUITY/(DEFICIT) Current liabilities: Accounts payable Accrued liabilities Accrued payroll and benefits Income taxes payable Current portion of operating lease liability Stored value card liability and current portion of deferred revenue Short-term debt Current portion of long-term debt Total current liabilities Long-term debt Operating lease liability Deferred revenue Other long-term liabilities Total liabilities 1,248.8 1,456.5 438.8 1,269.0 6,168.7 11,167.0 1,249.9 7,346.8 14.659.6 7,661.7 6,598.5 907.3 6,744.4 1,370.5 25,450.6 37,173.9 1.2 1.2 Shareholders' deficit: Common stock ($0.001 par value) authorized, 2,400.0 shares, issued and outstanding, 1,173.3 and 1,184.6 shares, respectively Additional paid-in capital Retained deficit Accumulated other comprehensive loss Total shareholders' deficit Noncontrolling interests Total deficit TOTAL LIABILITIES AND SHAREHOLDERS' EQUITY/(DEFICIT) 373.9 (7,815.6) (364.6) (7,805.1) 5.7 41.1 (5,771.2) (503.3) (6,232.2) 1.2 (6,231.0) (7,799.4) 29,374.5 S 19,219.6 Starbucks Corporation, Inc. Ratios 2018 2019 2020 Formulas Ratio 1 Current Ratio Liquidity Ratio 2 Quick Ratio Current Assets/ Current Liabilities (Current Assets - Inventory)/ Current Liabilities Current Assets - Current Liabilities Ratio 3 Net Working Capital Ratio 1 Asset Utilization/Turnover Ratio 2 Inventory Turnover Days Sales in Inventory Days Sales un Receivables Cost of Goods Sold / Inventory 365 Days / Inventory Turnover 365 Days / (Sales / Accounts Receivables) Ratio 3 Ratio 1 Profit Margin Profitability Ratio 2 Return on Assets Net Income / Sales Net Income / Total Assets Net Income / Total Equity Ratio 3 Return on Equity Ratio 1 Enterprise Value/EBITDA PEG Ratio Market Value Ratio 2 Market Value Per Share / Book Value Per Share Price Earning Ratio / Earnings Growth Rate Price Per Share / Sales Per Share Ratio 3 Price-Sales Ratio Ratio 1 Financial Leverage/Solvency Ratio 2 Debt to Equity Ratio Equity Multiplier Debt Ratio Total Liabilities / Total Shareholders Equity Total Assets / Total Shareholders Equity Total Liabolities / Total Assets Ratio 3 International Sep 29, 2019 Sep 30, 2018 Fiscal Year Ended Sep 29, 2019 Sep 30, 2018 As a % of International Total Net Revenues Net revenues: Company-operated stores Licensed stores $ 84.9 % 84.7 % 5,256.2 $ 917.0 4,702.1 837.0 14.8 15.1 Other 17.5 12.1 0.3 0.2 Total net revenues 100.0 100.0 30.6 30.8 6,190.7 1,894.9 2,428.5 116.4 5,551.2 1,709.4 2,182.3 98.9 39.2 39.3 1.9 1.8 511.5 447.6 8.3 8.1 Product and distribution costs Store operating expenses Other operating expenses Depreciation and amortization expenses General and administrative expenses Restructuring and impairments Total operating expenses Income from equity investees Operating income 317.9 302.5 5.1 5.4 59.2 55.1 1.0 1.0 86.1 86.4 5,328.4 102.4 4,795.8 117.4 1.7 2.1 $ 964.7 $ 872.8 15.6 % 15.7 % STARBUCKS CORPORATION CONSOLIDATED BALANCE SHEETS (in millions, except per share data) Sep 27, 2020 Sep 29, 2019 ASSETS S 2,686.6 70.5 879.2 4,350.9 281.2 883.4 1,551.4 739.5 7.806.4 206.1 1,529.4 488.2 Current assets: Cash and cash equivalents Short-term investments Accounts receivable, net Inventories Prepaid expenses and other current assets Total current assets Long-term investments Equity investments Property, plant and equipment, net Operating lease, right-of-use asset Deferred income taxes, net Other long-term assets Other intangible assets Goodwill TOTAL ASSETS 5,653.9 220.0 396.0 6,431.7 478.7 6,241.4 8,134.1 1,789.9 568.6 552.1 3,597.2 29,374.5 1,765.8 479.6 781.8 3,490.8 19,219.6 $ 997.9 S 1,160.7 696,0 1,189.7 1,753.7 664.6 98.2 1,291.7 LIABILITIES AND SHAREHOLDERS' EQUITY/(DEFICIT) Current liabilities: Accounts payable Accrued liabilities Accrued payroll and benefits Income taxes payable Current portion of operating lease liability Stored value card liability and current portion of deferred revenue Short-term debt Current portion of long-term debt Total current liabilities Long-term debt Operating lease liability Deferred revenue Other long-term liabilities Total liabilities 1,248.8 1,456.5 438.8 1,269.0 6,168.7 11,167.0 1,249.9 7,346.8 14.659.6 7,661.7 6,598.5 907.3 6,744.4 1,370.5 25,450.6 37,173.9 1.2 1.2 Shareholders' deficit: Common stock ($0.001 par value) authorized, 2,400.0 shares, issued and outstanding, 1,173.3 and 1,184.6 shares, respectively Additional paid-in capital Retained deficit Accumulated other comprehensive loss Total shareholders' deficit Noncontrolling interests Total deficit TOTAL LIABILITIES AND SHAREHOLDERS' EQUITY/(DEFICIT) 373.9 (7,815.6) (364.6) (7,805.1) 5.7 41.1 (5,771.2) (503.3) (6,232.2) 1.2 (6,231.0) (7,799.4) 29,374.5 S 19,219.6 Starbucks Corporation, Inc. Ratios 2018 2019 2020 Formulas Ratio 1 Current Ratio Liquidity Ratio 2 Quick Ratio Current Assets/ Current Liabilities (Current Assets - Inventory)/ Current Liabilities Current Assets - Current Liabilities Ratio 3 Net Working Capital Ratio 1 Asset Utilization/Turnover Ratio 2 Inventory Turnover Days Sales in Inventory Days Sales un Receivables Cost of Goods Sold / Inventory 365 Days / Inventory Turnover 365 Days / (Sales / Accounts Receivables) Ratio 3 Ratio 1 Profit Margin Profitability Ratio 2 Return on Assets Net Income / Sales Net Income / Total Assets Net Income / Total Equity Ratio 3 Return on Equity Ratio 1 Enterprise Value/EBITDA PEG Ratio Market Value Ratio 2 Market Value Per Share / Book Value Per Share Price Earning Ratio / Earnings Growth Rate Price Per Share / Sales Per Share Ratio 3 Price-Sales Ratio Ratio 1 Financial Leverage/Solvency Ratio 2 Debt to Equity Ratio Equity Multiplier Debt Ratio Total Liabilities / Total Shareholders Equity Total Assets / Total Shareholders Equity Total Liabolities / Total Assets Ratio 3
Step by Step Solution
There are 3 Steps involved in it

Get step-by-step solutions from verified subject matter experts