

Question: A thru C The accompanying data table shows the level of social media networking (measured as the percent of individuals polled who use social networking
A thru C
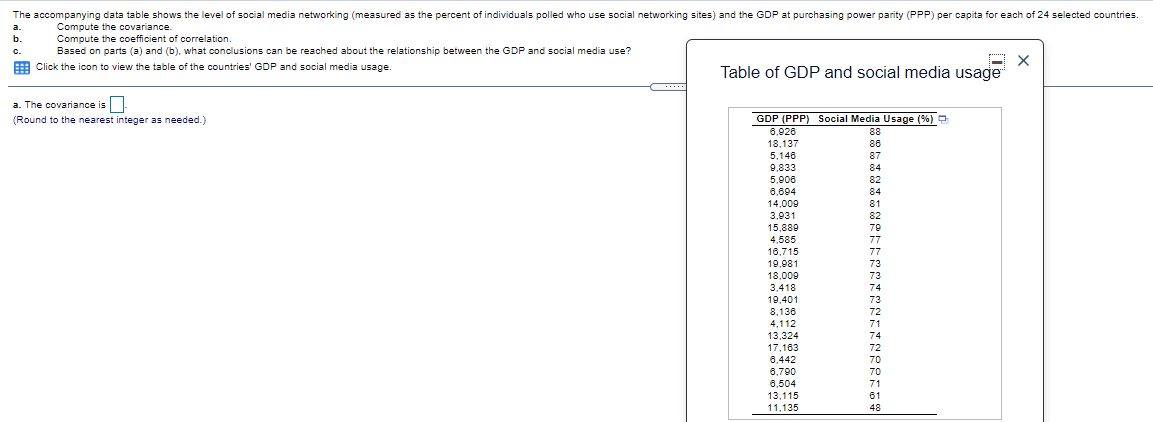
The accompanying data table shows the level of social media networking (measured as the percent of individuals polled who use social networking sites) and the GDP at purchasing power parity (PPP) per capita for each of 24 selected countries. a. Compute the covariance. Compute the coefficient of correlation. Based on parts (a) and (b), what conclusions can be reached about the relationship between the GDP and social media use? E..... [Click the icon to view the table of the countries' GDP and social media usage. X Table of GDP and social media usage . . . . . . The covariance is (Round to the nearest integer as needed.) GDP (PPP) Social Media Usage (%) 6,926 88 18.137 86 5.148 87 9.833 84 5,906 82 6.694 84 14,009 81 3,931 82 15.889 79 4,585 77 16,715 77 19.981 73 18,009 73 3,418 74 19.401 73 8.136 72 4,112 71 13,324 74 17.163 72 6.442 70 6.790 70 6,504 71 13.115 61 11.135 48
Step by Step Solution
There are 3 Steps involved in it

Get step-by-step solutions from verified subject matter experts