

Question: A time series with forecast values and error terms is presented in the following table. Month Actual Forecast Error Aug 11 15 -4 Sept 13
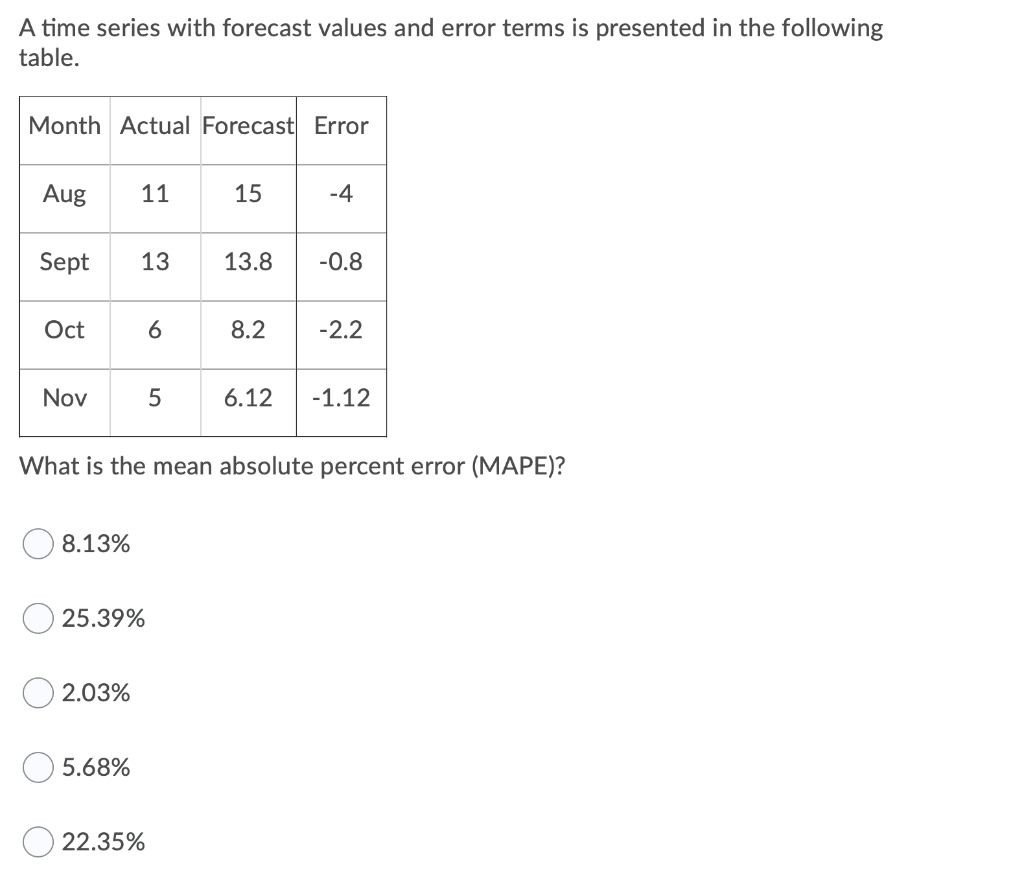
A time series with forecast values and error terms is presented in the following table. Month Actual Forecast Error Aug 11 15 -4 Sept 13 13.8 -0.8 Oct 6 8.2 -2.2 Nov 5 6.12 -1.12 What is the mean absolute percent error (MAPE)? 8.13% 25.39% 2.03% 5.68% 22.35% A time series with forecast values and error terms is presented in the following table. Month Actual Forecast Error Aug 11 15 -4 Sept 13 13.8 -0.8 Oct 6 8.2 -2.2 Nov 5 6.12 -1.12 What is the mean absolute percent error (MAPE)? 8.13% 25.39% 2.03% 5.68% 22.35%
Step by Step Solution
There are 3 Steps involved in it
1 Expert Approved Answer
Step: 1 Unlock

Question Has Been Solved by an Expert!
Get step-by-step solutions from verified subject matter experts
Step: 2 Unlock
Step: 3 Unlock