

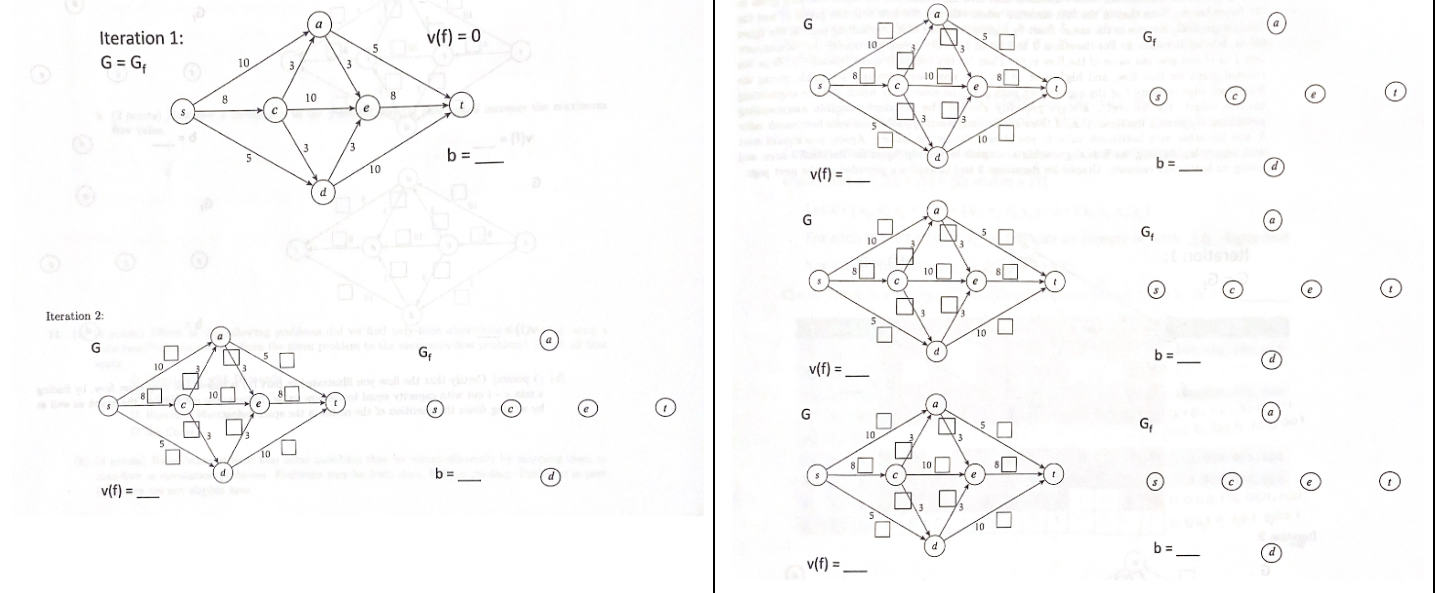
Question: a ) Trace through the Ford - Fulkerson max flow algorithm on the input instance given in the figure below. Note that in the first
a Trace through the FordFulkerson max flow algorithm on the input instance given in the figure below. Note that in the first iteration when value of the flow is the graph G and the residual graph Gy are one in the same. Start by highlighting the first augmenting path in the figure below, labeled Iteration For iterations and later, indicate using the boxes the currentnew flow f in G and give the value of the low vf Then in the provided space labeled G draw the residual graph for that flow, and highlight in G the next augmenting st path, giving the bottleneck edge capacity b of the augmenting path ie the amount by which you are augmenting the flow value For full credit, always greedily choose the greatestpossible augmenting path from G in each iteration. Le if there are two augmenting paths, one with bottleneck value and the other with bottleneck value you should choose the latter. Again, you should start with simply highlighting the first augmenting s t path in the top figure for Iteration here, and giving its bottleneck capacity. b Certify that the flow you illustrated in part a is indeed the maximum flow, by finding a min s t cut with capacity equal to the flow value. Indicate the cut both on the graph as well as by writing down the partition of the nodes.
Step by Step Solution
There are 3 Steps involved in it
1 Expert Approved Answer
Step: 1 Unlock

Question Has Been Solved by an Expert!
Get step-by-step solutions from verified subject matter experts
Step: 2 Unlock
Step: 3 Unlock