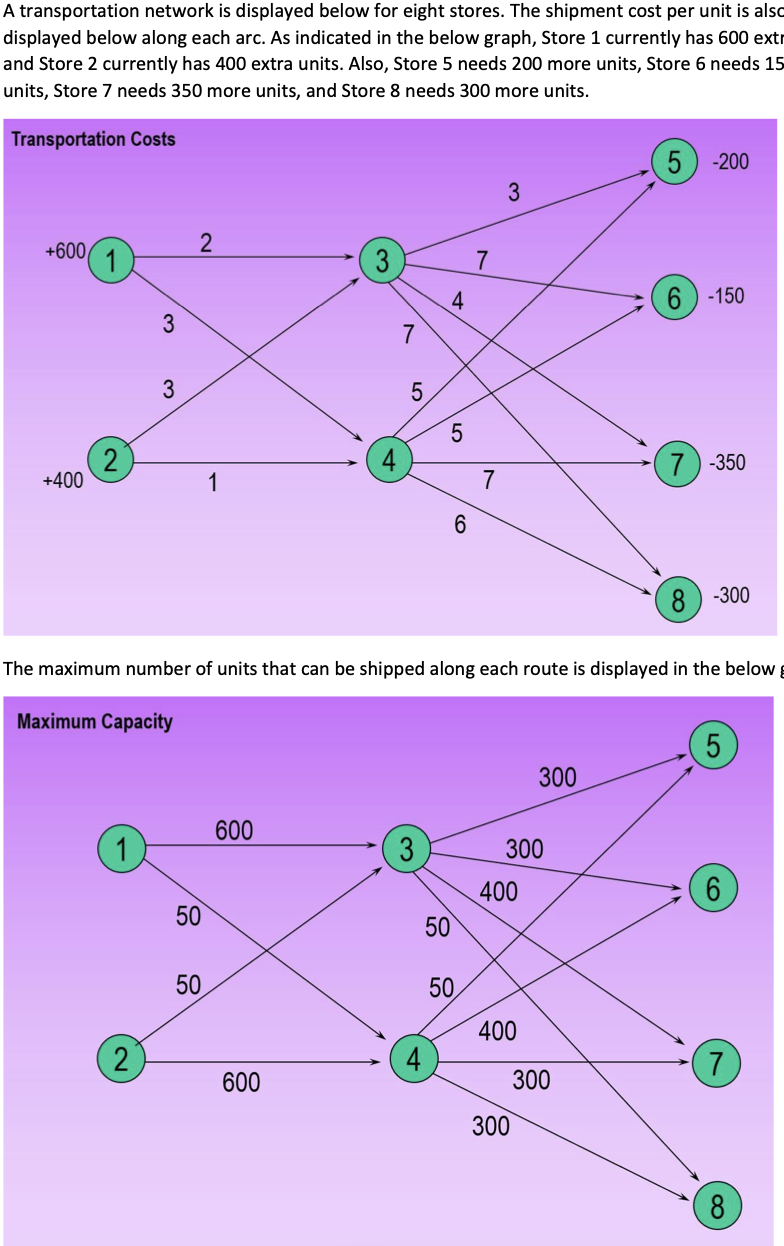
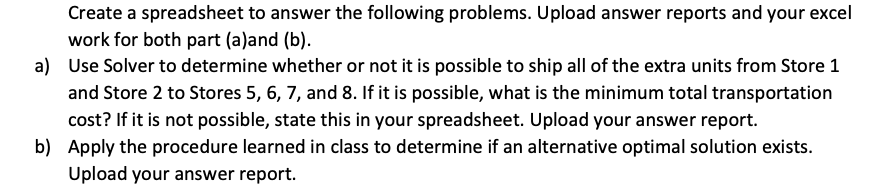
Question: A transportation network is displayed below for eight stores. The shipment cost per unit is also displayed below along each arc. As indicated in the

A transportation network is displayed below for

A transportation network is displayed below for

A transportation network is displayed below for eight stores. The shipment cost per unit is also displayed below along each arc. As indicated in the below graph, Store 1 currently has 600 extr and Store 2 currently has 400 extra units. Also, Store 5 needs 200 more units, Store 6 needs 15 units, Store 7 needs 350 more units, and Store 8 needs 300 more units. Transportation Costs 5 -200 3 +600 2 1 3 7 4 6-150 3 7 3 5 5 2 (7) -350 +400 1 7 6 8 -300 The maximum number of units that can be shipped along each route is displayed in the below Maximum Capacity 5 300 600 3 300 400 6 50 50 50 50 400 2 4 7 600 300 300 oo 8 Create a spreadsheet to answer the following problems. Upload answer reports and your excel work for both part (a)and (b). a) Use Solver to determine whether or not it is possible to ship all of the extra units from Store 1 and Store 2 to Stores 5, 6, 7, and 8. If it is possible, what is the minimum total transportation cost? If it is not possible, state this in your spreadsheet. Upload your answer report. b) Apply the procedure learned in class to determine if an alternative optimal solution exists. Upload your answer report

Step by Step Solution

There are 3 Steps involved in it

1 Expert Approved Answer
Step: 1 Unlock blur-text-image
Question Has Been Solved by an Expert!

Get step-by-step solutions from verified subject matter experts

Step: 2 Unlock
Step: 3 Unlock

Students Have Also Explored These Related General Management Questions!