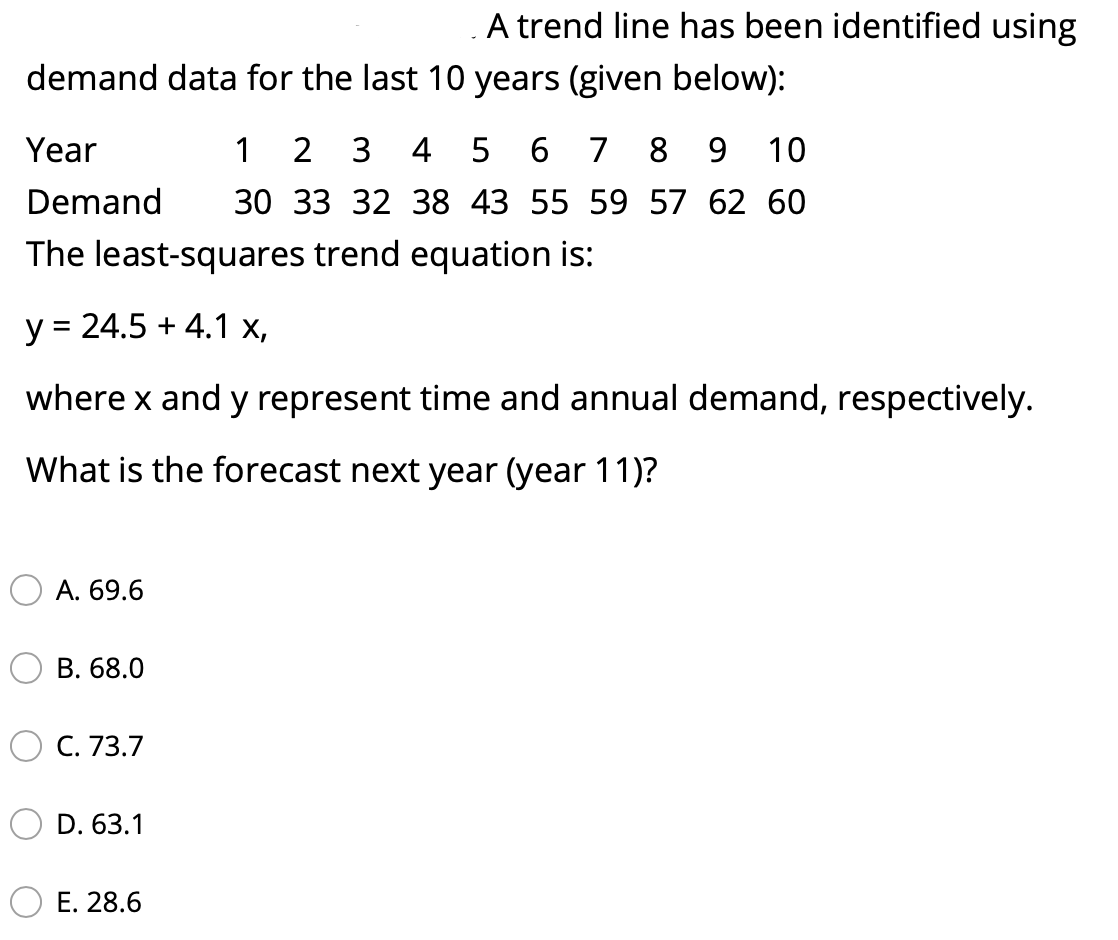
Question: A trend line has been identified using demand data for the last 10 years (given below) A trend line has been identified using demand data

A trend line has been identified using demand data for the last 10 years (given below)

A trend line has been identified using demand

A trend line has been identified using demand data for the last 10 years (given below): Year 1 2 3 4 5 6 7 8 9 10 Demand 30 33 32 38 43 55 59 57 62 60 The least-squares trend equation is: y = 24.5 + 4.1 x, where x and y represent time and annual demand, respectively. What is the forecast next year (year 11)? A. 69.6 B. 68.0 C. 73.7 D. 63.1 E. 28.6

Step by Step Solution

There are 3 Steps involved in it

1 Expert Approved Answer
Step: 1 Unlock blur-text-image
Question Has Been Solved by an Expert!

Get step-by-step solutions from verified subject matter experts

Step: 2 Unlock
Step: 3 Unlock

Students Have Also Explored These Related General Management Questions!