

Question: A trucking company considered a multiple regression model for relating the dependent variable of total daily travel time for one of its drivers (hours) to
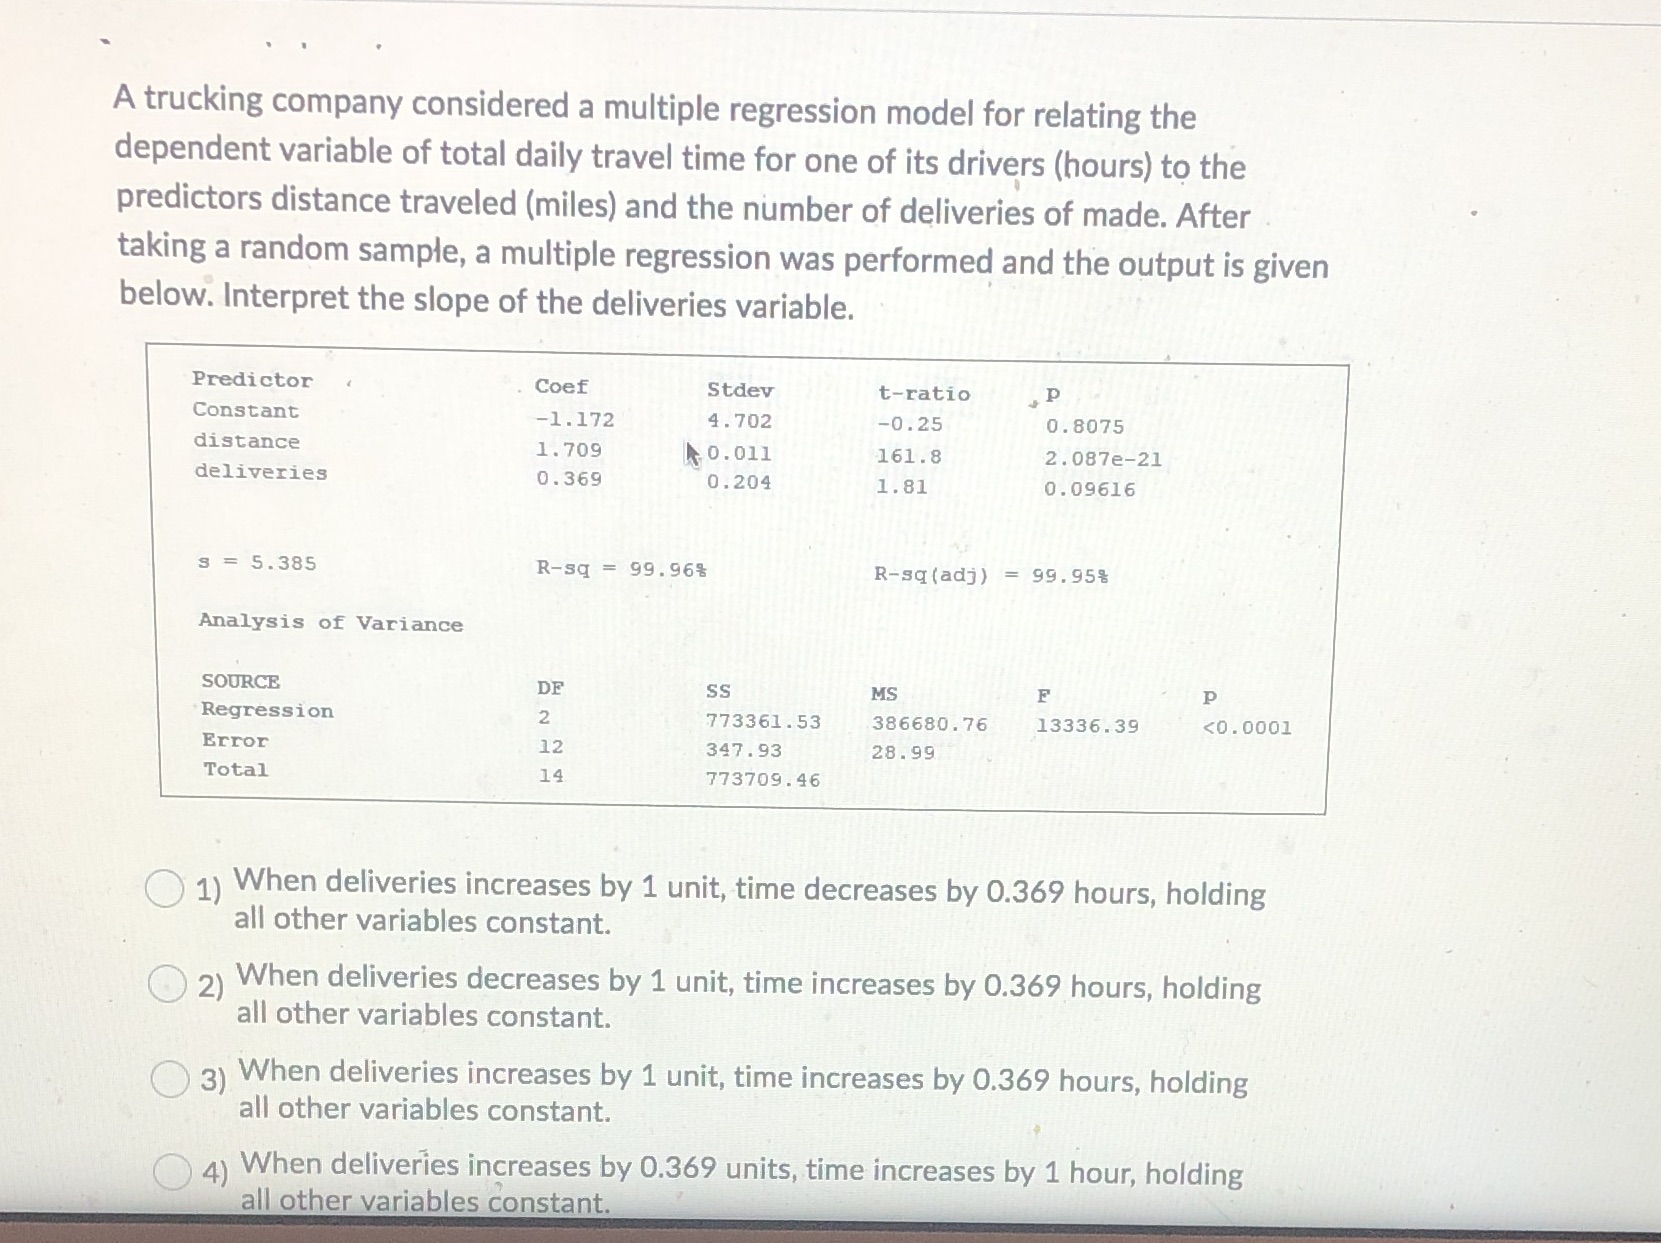
A trucking company considered a multiple regression model for relating the dependent variable of total daily travel time for one of its drivers (hours) to the predictors distance traveled (miles) and the number of deliveries of made. After taking a random sample, a multiple regression was performed and the output is given below. Interpret the slope of the deliveries variable. Predictor Coef Stdev t-ratio P Constant -1. 172 4. 702 -0. 25 0. 8075 distance 1. 709 10. 011 161 .8 2. 087e-21 deliveries 0. 369 0 . 204 1. 81 0 . 09616 9 = 5.385 R-sq = 99. 968 R-sq (adj ) = 99. 958 Analysis of Variance SOURCE DE SS MS F P Regression 2 773361.53 386680. 76 13336.39
Step by Step Solution
There are 3 Steps involved in it

Get step-by-step solutions from verified subject matter experts