

Question: A typical profit-volume graph follows. A B. Required a. Identify each of the following: 1. Area BDC 2. Area DEF 3. Point D 4.
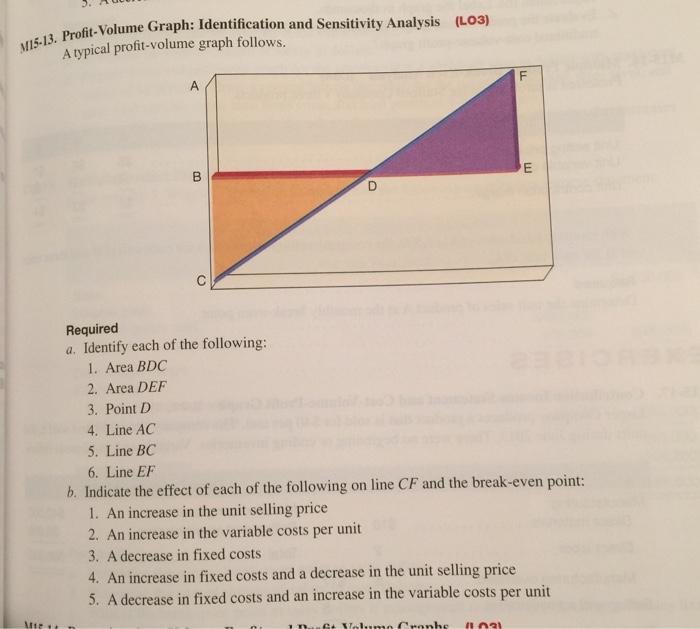
A typical profit-volume graph follows. A B. Required a. Identify each of the following: 1. Area BDC 2. Area DEF 3. Point D 4. Line AC 5. Line BC 6. Line EF b. Indicate the effect of each of the following on line CF and the break-even point: 1. An increase in the unit selling price 2. An increase in the variable costs per unit 3. A decrease in fixed costs 4. An increase in fixed costs and a decrease in the unit selling price 5. A decrease in fixed costs and an increase in the variable costs per unit &+ Vol mo Cranhe
Step by Step Solution
3.39 Rating (152 Votes )
There are 3 Steps involved in it
Requirement a 1 Area BDC Loss area 2 Area DEF Profit area 3 Point D ... View full answer

Get step-by-step solutions from verified subject matter experts