

Question: A Union Wage Premium? TwoSample Univariate Hypothesis Testing Consider a random sample of 12 construction workers, six of whom belong to a labor union and
- A Union Wage Premium? TwoSample Univariate Hypothesis Testing
Consider a random sample of 12 construction workers, six of whom belong to a labor union and six of whom do not. The hourly wages for each worker are reported below:
| Wages of union members | Wages of nonunion members |
| 18 | 25 |
| 30 | 20 |
| 40 | 34 |
| 35 | 30 |
| 26 | 20 |
| 25 | 15 |
- Test whether the population variance of one group is greater than the population variance of the other group using an F test. Test at the 5 percent level of significance? What is the value of your test statistic and what is the critical value? What can you conclude and why?
- Test whether union members in the population have higher wages than nonunion members using a ttest. What are the null and alternative hypotheses? Which version of the ttest should you use and why? What can you conclude at the 10percent level of significance? Explain.
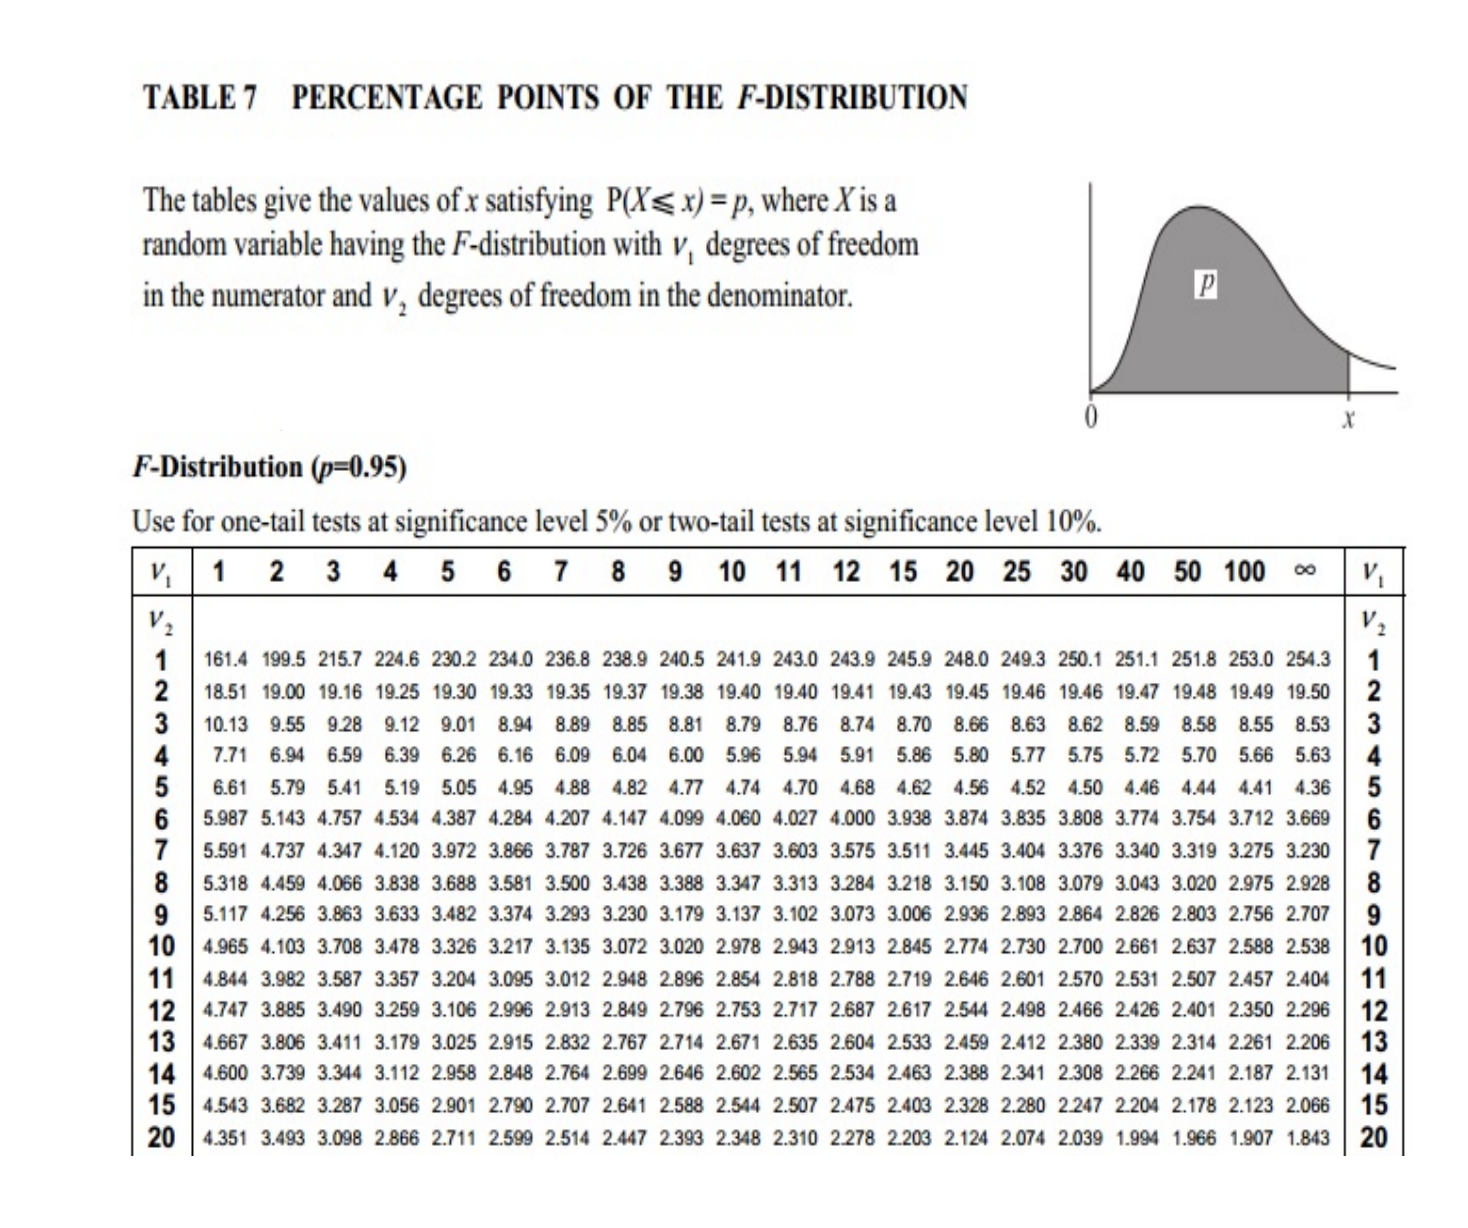
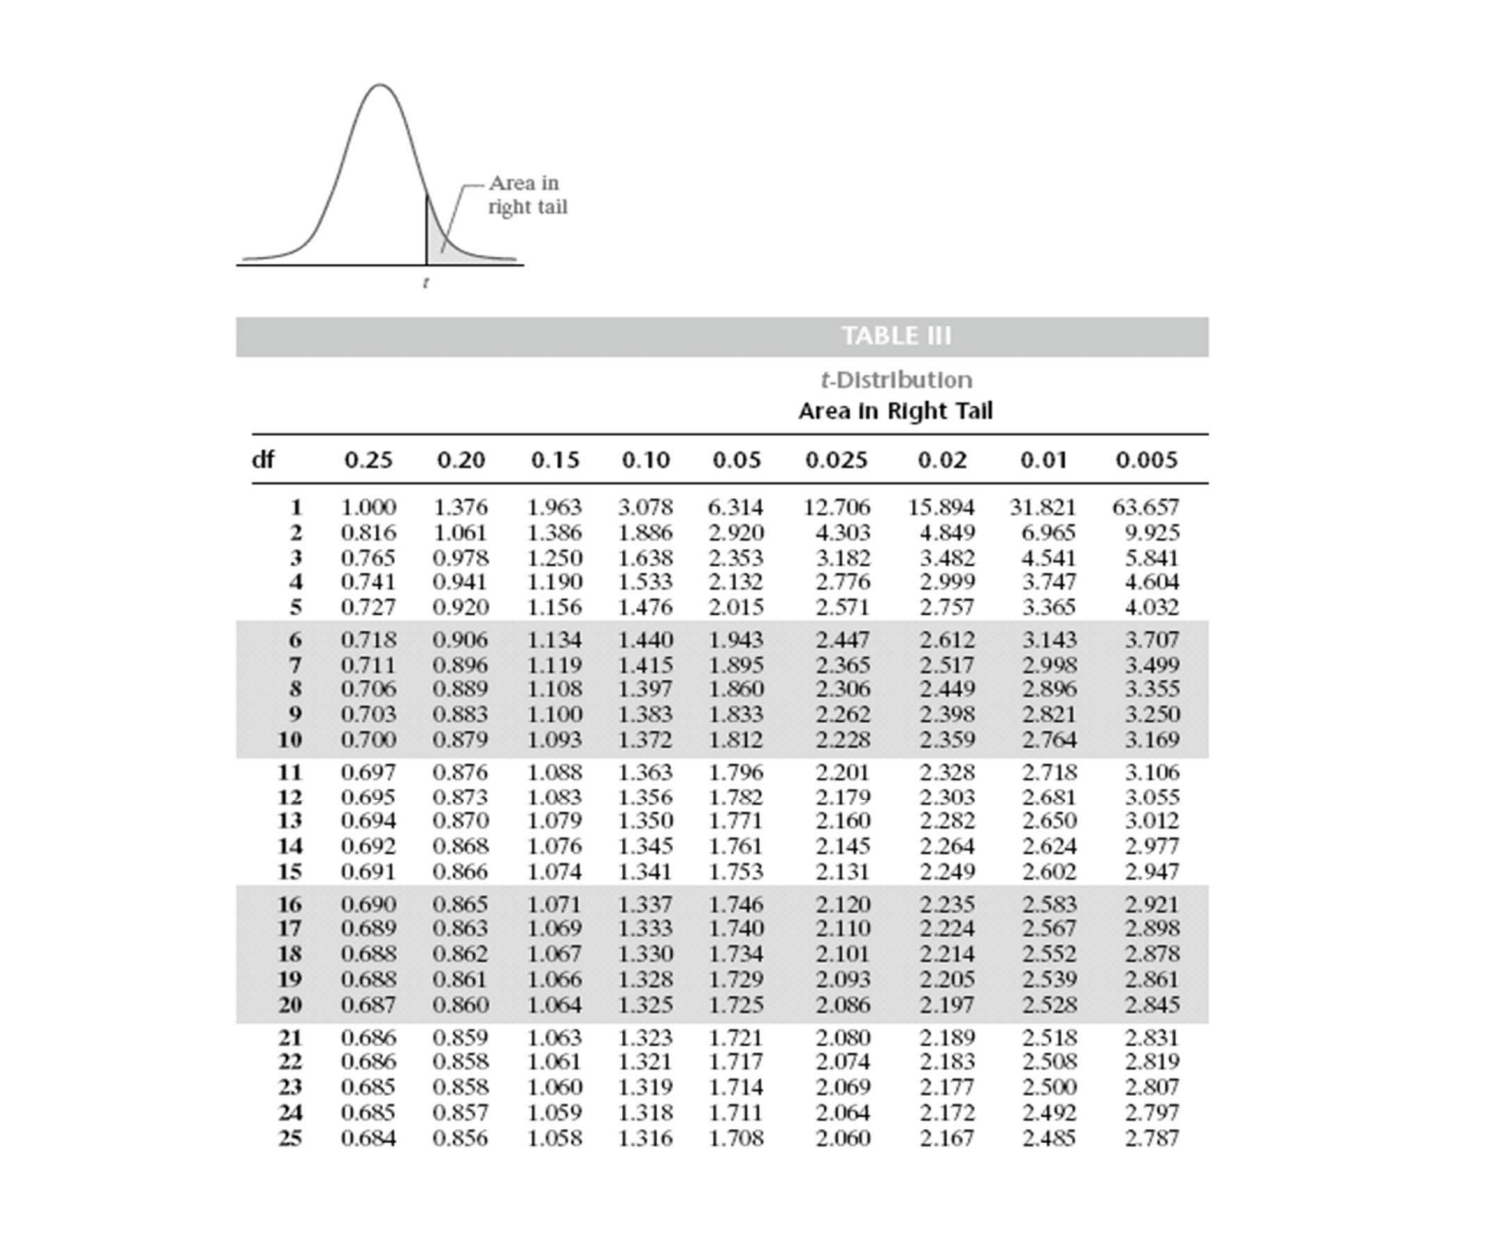
TABLE 7 PERCENTAGE POINTS OF THE F-DISTRIBUTION The tables give the values of x satisfying P(X x) =p, where X is a random variable having the F-distribution with v, degrees of freedom in the numerator and v, degrees of freedom in the denominator. P F-Distribution (p=0.95) Use for one-tail tests at significance level 5% or two-tail tests at significance level 10%. 1 2 3 4 5 6 7 8 9 10 11 12 15 20 25 30 40 50 100 00 V, 161.4 199.5 215.7 224.6 230.2 234.0 236.8 238.9 240.5 241.9 243.0 243.9 245.9 248.0 249.3 250.1 251.1 251.8 253.0 254.3 18.51 19.00 19.16 19.25 19.30 19.33 19.35 19.37 19.38 19.40 19.40 19.41 19.43 19.45 19.46 19.46 19.47 19.48 19.49 19.50 10.13 9.55 9.28 9.12 9.01 8.94 8.89 8.85 8.81 8.79 8.76 8.74 8.70 8.66 8.63 8.62 8.59 8.58 8.55 8.53 7.71 6.94 6.59 6.39 6.26 6.16 6.09 6.04 6.00 5.96 5.94 5.91 5.86 5.80 5.77 5.75 5.72 5.70 5.66 5.63 6.61 5.79 5.41 5.19 5.05 4.95 4.88 4.82 4.77 4.74 4.70 4.68 4.62 4.56 4.52 4.50 4.46 4.44 4.41 4.36 5.987 5.143 4.757 4.534 4.387 4.284 4.207 4.147 4.099 4.060 4.027 4.000 3.938 3.874 3.835 3.808 3.774 3.754 3.712 3.669 5.591 4.737 4.347 4.120 3.972 3.866 3.787 3.726 3.677 3.637 3.603 3.575 3.511 3.445 3.404 3.376 3.340 3.319 3.275 3.230 5.318 4.459 4.066 3.838 3.688 3.581 3.500 3.438 3.388 3.347 3.313 3.284 3.218 3.150 3.108 3.079 3.043 3.020 2.975 2.928 5.117 4.256 3.863 3.633 3.482 3.374 3.293 3.230 3.179 3.137 3.102 3.073 3.006 2.936 2.893 2.864 2.826 2.803 2.756 2.707 4.965 4.103 3.708 3.478 3.326 3.217 3.135 3.072 3.020 2.978 2.943 2.913 2.845 2.774 2.730 2.700 2.661 2.637 2.588 2.538 4.844 3.982 3.587 3.357 3.204 3.095 3.012 2.948 2.896 2.854 2.818 2.788 2.719 2.646 2.601 2.570 2.531 2.507 2.457 2.404 11 4.747 3.885 3.490 3.259 3.106 2.996 2.913 2.849 2.796 2.753 2.717 2.687 2.617 2.544 2.498 2.466 2.426 2.401 2.350 2.296 12 4.667 3.806 3.411 3.179 3.025 2.915 2.832 2.767 2.714 2.671 2.635 2.604 2.533 2.459 2.412 2.380 2.339 2.314 2.261 2.206 13 4.600 3.739 3.344 3.112 2.958 2.848 2.764 2.699 2.646 2.602 2.565 2.534 2.463 2.388 2.341 2.308 2.266 2.241 2.187 2.131 14 4.543 3.682 3.287 3.056 2.901 2.790 2.707 2.641 2.588 2.544 2.507 2.475 2.403 2.328 2.280 2.247 2.204 2.178 2.123 2.066 15 20 4.351 3.493 3.098 2.866 2.711 2.599 2.514 2.447 2.393 2.348 2.310 2.278 2.203 2.124 2.074 2.039 1.994 1.966 1.907 1.843 20Area in right tail TABLE III t-Distribution Area In Right Tall df 0.25 0.20 0.15 0.10 0.05 0.025 0.02 0.01 0.005 1.000 1.376 1.963 3.078 6.314 12.706 15.894 31.821 63.657 0.816 1.061 1.386 1.886 2.920 4.303 4.849 6.965 9.925 0.765 0.978 1.250 1.638 2.353 3.182 3.482 4.541 5.841 0.741 0.941 1.190 1.533 2.132 2.776 2.999 3.747 4.604 0.727 0.920 1.156 1.476 2.015 2.571 2.757 3.365 4.032 GOTAMAWINE 0.718 0.906 1.134 1.440 1.943 2.447 2.612 3.143 3.707 0.711 0.896 1.119 1.415 1.895 2.365 2.517 2.998 3.499 0.706 0.889 1.108 1.397 1.860 2.306 2.449 2.896 3.355 0.703 0.883 1.100 1.383 1.833 2.262 2.398 2.821 3.250 10 0.700 0.879 1.093 1.372 1.812 2.228 2.359 2.764 3.169 11 0.697 0.876 1.088 1.363 1.796 2.201 2.328 2.718 3.106 12 0.695 0.873 1.083 1.356 1.782 2.179 2.303 2.681 3.055 13 0.694 0.870 1.079 1.350 1.771 2.160 2.282 2.650 3.012 14 0.692 0.868 1.076 1.345 1.761 2.145 2.264 2.624 2.977 15 0.691 0.866 1.074 1.341 1.753 2.131 2.249 2.602 2.947 16 0.690 0.865 1.071 1.337 1.746 2.120 2.235 2.583 2.921 17 0.689 0.863 1.069 1.333 1.740 2.110 2.224 2.567 2.898 18 0.688 0.862 1.067 1.330 1.734 2.101 2.214 2.552 2.878 19 0.688 0.861 1.066 1.328 1.729 2.093 2.205 2.539 2.861 20 0.687 0.860 1.064 1.325 1.725 2.086 2.197 2.528 2.845 21 0.686 0.859 1.063 1.323 1.721 2.080 2.189 2.518 2.831 22 0.686 0.858 1.061 1.321 1.717 2.074 2.183 2.508 2.819 23 0.685 0.858 1.060 1.319 1.714 2.069 2.177 2.500 2.807 24 0.685 0.857 1.059 1.318 1.711 2.064 2.172 2.492 2.797 25 0.684 0.856 1.058 1.316 1.708 2.060 2.167 2.485 2.787
Step by Step Solution
There are 3 Steps involved in it

Get step-by-step solutions from verified subject matter experts