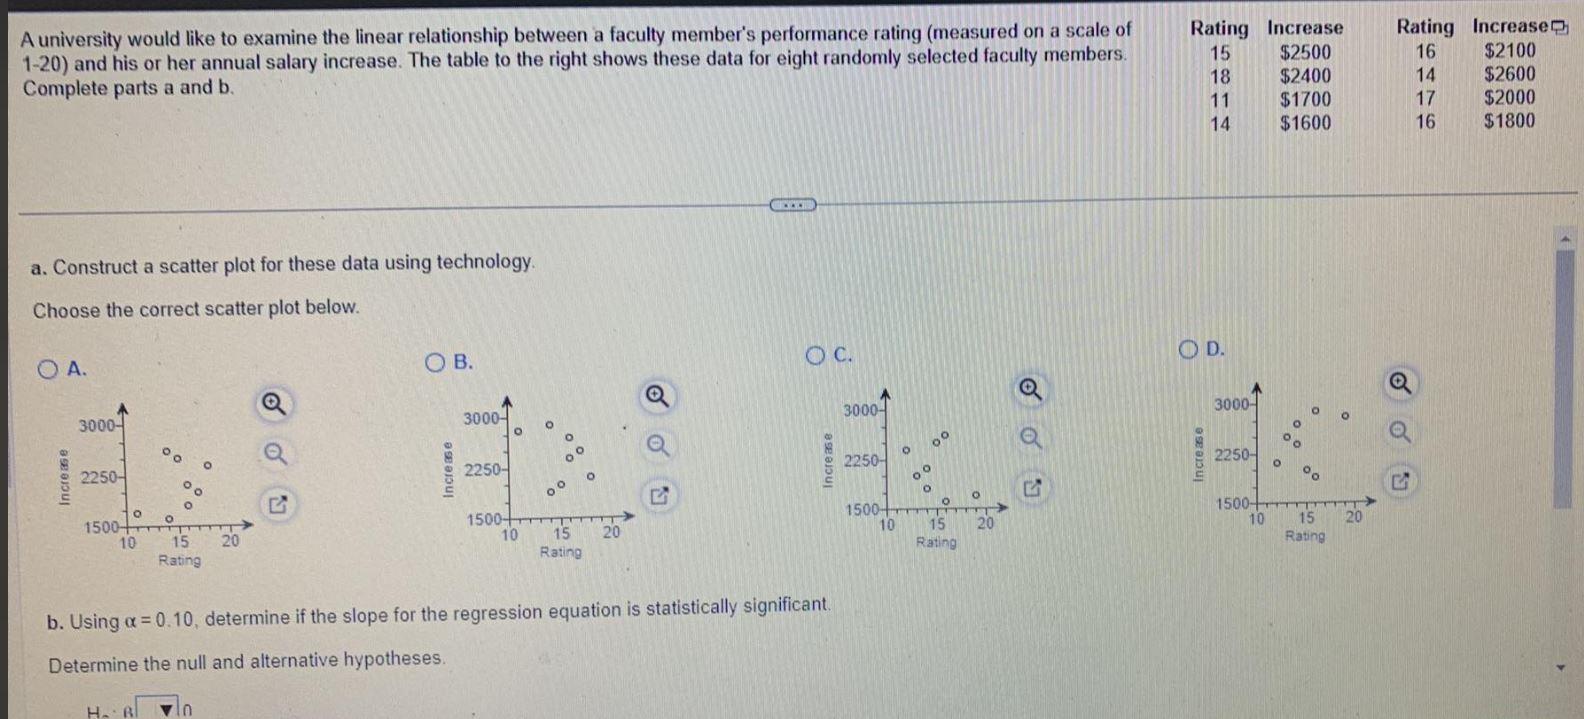
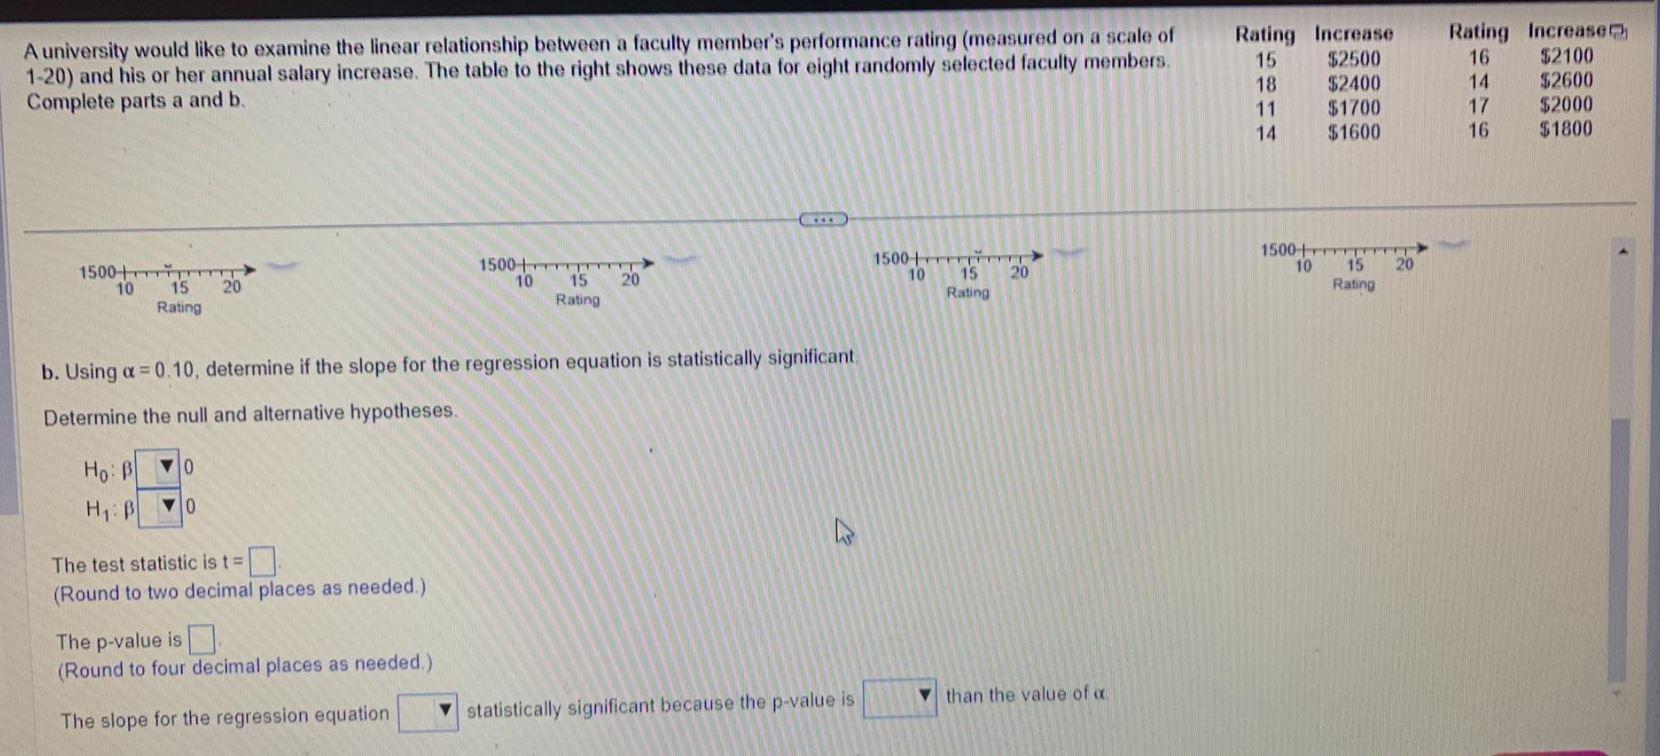
Question: A university would like to examine the linear relationship between a faculty member's performance rating (measured on a scale of 1-20) and his or her

A university would like to examine the linearA university would like to examine the linear

A university would like to examine the linear relationship between a faculty member's performance rating (measured on a scale of 1-20) and his or her annual salary increase. The table to the right shows these data for eight randomly selected faculty members. Complete parts a and b. a. Construct a scatter plot for these data using technology. Choose the correct scatter plot below. A. B. c. D. b. Using =0.10, determine if the slope for the regression equation is statistically significant. Determine the null and alternative hypotheses. A university would like to examine the linear relationship between a faculty member's performance rating (measured on a scale of 1-20) and his or her annual salary increase. The table to the right shows these data for eight randomly selected faculty members. Complete parts a and b. b. Using =0.10, determine if the slope for the regression equation is statistically significant Determine the null and alternative hypotheses. The test statistic is t= (Round to two decimal places as needed.) The p-value is (Round to four decimal places as needed.) The slope for the regression equation statistically significant because the p-value is than the value of

Step by Step Solution

There are 3 Steps involved in it

1 Expert Approved Answer
Step: 1 Unlock blur-text-image
Question Has Been Solved by an Expert!

Get step-by-step solutions from verified subject matter experts

Step: 2 Unlock
Step: 3 Unlock

Students Have Also Explored These Related General Management Questions!