

Question: a) Upper Control Limit (UCL)=______ b) Lower Control Limit (LCL)=______ begin{tabular}{lccccccccccccccccccccccccc} hline DAY & 1 & 2 & 3 & 4 & 5 & 6

a) Upper Control Limit (UCL)=______
b) Lower Control Limit (LCL)=______
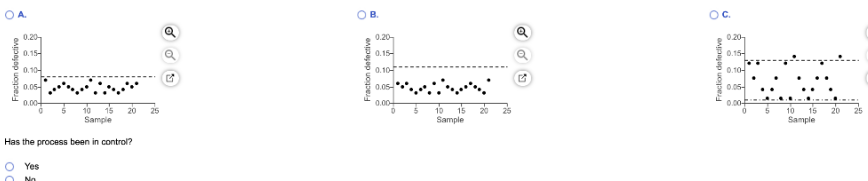
\begin{tabular}{lccccccccccccccccccccccccc} \hline DAY & 1 & 2 & 3 & 4 & 5 & 6 & 7 & 8 & 9 & 10 & 11 & 12 & 13 & 14 & 15 & 16 & 17 & 18 & 19 & 20 & 21 \\ \hline DEFECTIVES & 3 & 2 & 3 & 7 & 3 & 4 & 2 & 6 & 12 & 4 & 7 & 5 & 7 & 3 & 8 & 3 & 5 & 8 & 4 & 3 & 2 \\ \hline \end{tabular} Develop a 3 standard deviation ( 99.73% confidence) p-chart and graph the samples. Has the process been in control? \begin{tabular}{lccccccccccccccccccccccccc} \hline DAY & 1 & 2 & 3 & 4 & 5 & 6 & 7 & 8 & 9 & 10 & 11 & 12 & 13 & 14 & 15 & 16 & 17 & 18 & 19 & 20 & 21 \\ \hline DEFECTIVES & 3 & 2 & 3 & 7 & 3 & 4 & 2 & 6 & 12 & 4 & 7 & 5 & 7 & 3 & 8 & 3 & 5 & 8 & 4 & 3 & 2 \\ \hline \end{tabular} Develop a 3 standard deviation ( 99.73% confidence) p-chart and graph the samples. Has the process been in control
Step by Step Solution
There are 3 Steps involved in it

Get step-by-step solutions from verified subject matter experts