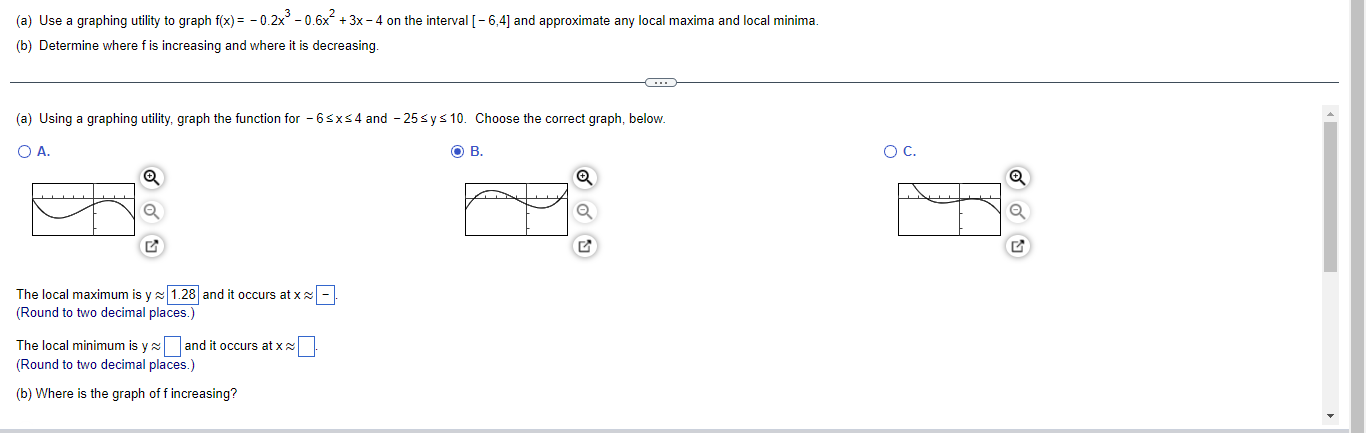
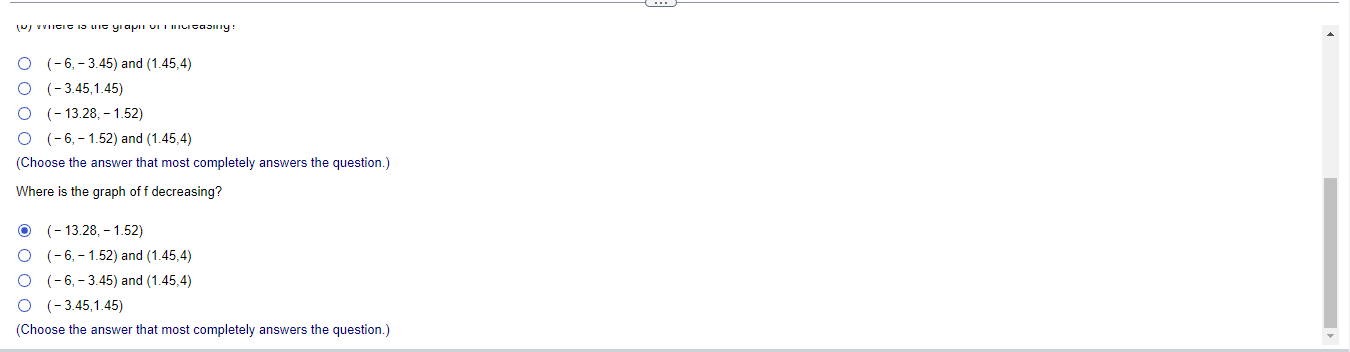
Question: (a) Use a graphing utility to graph f(x) = - 0.2x - 0.6x + 3x - 4 on the interval [ - 6,4] and approximate

(a) Use a graphing utility to graph f(x) = -(a) Use a graphing utility to graph f(x) = -
(a) Use a graphing utility to graph f(x) = - 0.2x" - 0.6x" + 3x - 4 on the interval [ - 6,4] and approximate any local maxima and local minima. (b) Determine where f is increasing and where it is decreasing. (a) Using a graphing utility, graph the function for - 65x4 and - 25 sys 10. Choose the correct graph, below. O A. O B. O C. The local maximum is y ~ 1.28 and it occurs at x ~ [-]. (Round to two decimal places.) The local minimum is y ~ and it occurs at x ~ (Round to two decimal places.) (b) Where is the graph of f increasing?\\u' uncut: ID un: 3m..." u. I mummy: o {5,3.45] and (1.45.41 0 (3.45'1.45) O (43,23,452) o (73,7152) and (145,4) (Choose the amwer that most completely answers the question) Where is the graph of f decreasing? [13.23,1_52) o {6,1.52] and (1.45.41 0 {3,345) and (145,4) 0 (445,145) (Choose the amwer that most completely answers the question)

Step by Step Solution

There are 3 Steps involved in it

1 Expert Approved Answer
Step: 1 Unlock blur-text-image
Question Has Been Solved by an Expert!

Get step-by-step solutions from verified subject matter experts

Step: 2 Unlock
Step: 3 Unlock

Students Have Also Explored These Related Mathematics Questions!