

Question: A. Use a linear trend and a quadratic trend model to generate forecasts for the 4th quarter of 2017 and the first quarter of 2018.
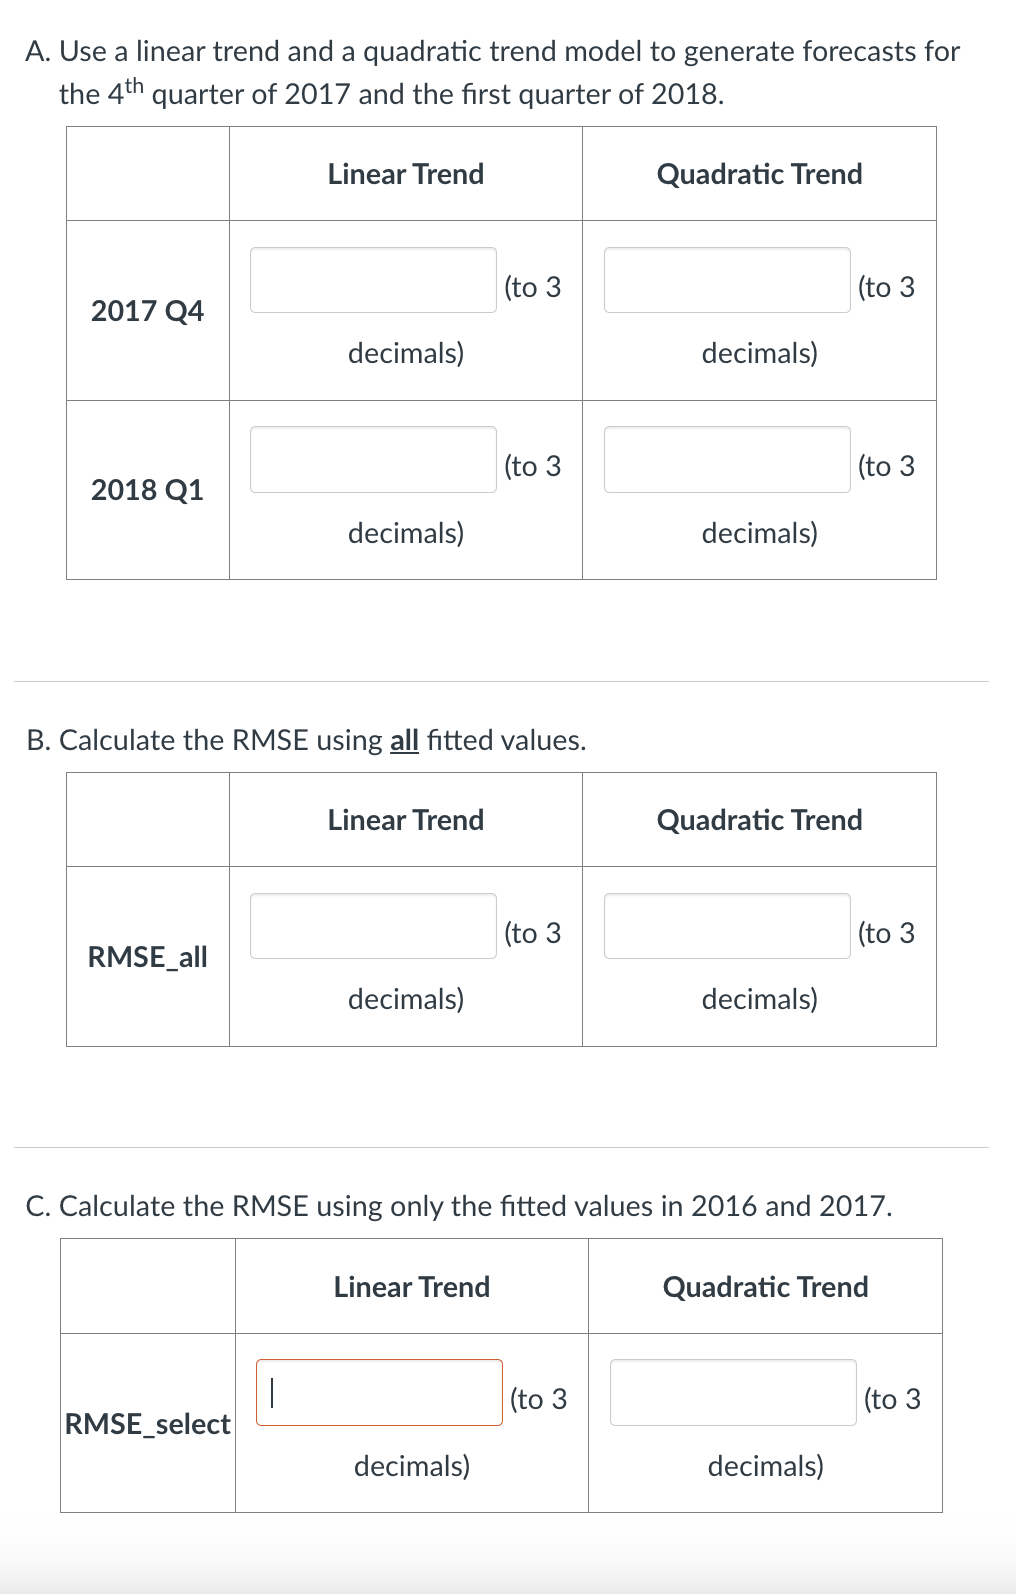
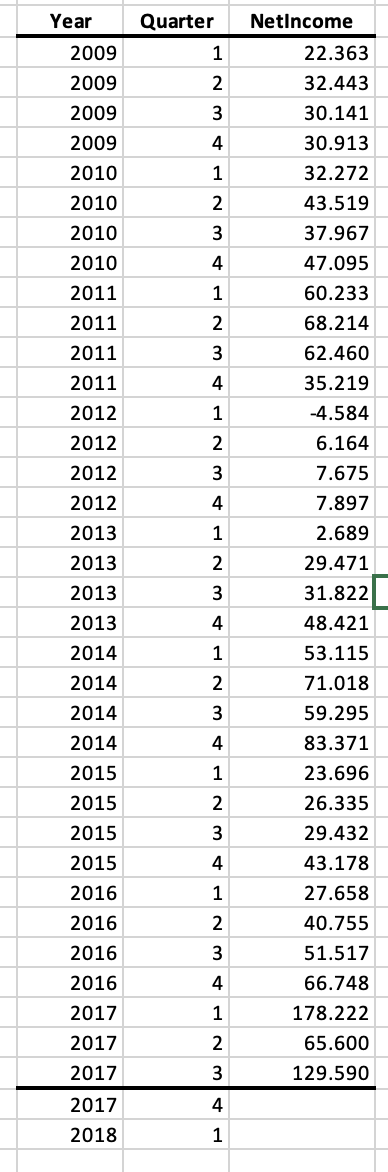
A. Use a linear trend and a quadratic trend model to generate forecasts for the 4th quarter of 2017 and the first quarter of 2018. B. Calculate the RMSE using all fitted values. C. Calculate the RMSE using only the fitted values in 2016 and 2017. \begin{tabular}{|r|r|r|} \hline Year & Quarter & NetIncome \\ \hline 2009 & 1 & 22.363 \\ \hline 2009 & 2 & 32.443 \\ \hline 2009 & 3 & 30.141 \\ \hline 2009 & 4 & 30.913 \\ \hline 2010 & 1 & 32.272 \\ \hline 2010 & 2 & 43.519 \\ \hline 2010 & 3 & 37.967 \\ \hline 2010 & 4 & 47.095 \\ \hline 2011 & 1 & 60.233 \\ \hline 2011 & 2 & 68.214 \\ \hline 2011 & 3 & 62.460 \\ \hline 2011 & 4 & 35.219 \\ \hline 2012 & 1 & 4.584 \\ \hline 2012 & 2 & 6.164 \\ \hline 2012 & 3 & 7.675 \\ \hline 2012 & 4 & 7.897 \\ \hline 2013 & 1 & 2.689 \\ \hline 2013 & 2 & 29.471 \\ \hline 2013 & 3 & 31.822 \\ \hline 2013 & 4 & 48.421 \\ \hline 2014 & 1 & 53.115 \\ \hline 2014 & 2 & 1 \\ \hline 2014 & 2 & 71.018 \\ \hline 2014 & 3 & 59.295 \\ \hline 2015 & 4 & 83.371 \\ \hline 2015 & 1 & 23.696 \\ \hline 2015 & 2 & 26.335 \\ \hline 2015 & 3 & 29.432 \\ \hline 2016 & 4 & 43.178 \\ \hline 2016 & 1 & 27.658 \\ \hline 2016 & 2 & 40.755 \\ \hline 2016 & 3 & 51.517 \\ \hline \end{tabular}
Step by Step Solution
There are 3 Steps involved in it

Get step-by-step solutions from verified subject matter experts