

Question: (a) Use Excel (or other suitable spreadsheet programs) to calculate the 3 years moving average using the year before (t-1) to the year after (t+1).
(a) Use Excel (or other suitable spreadsheet programs) to calculate the 3 years moving average using the year before (t-1) to the year after (t+1). For instance, for the year 1997, determine the moving average by averaging 1996, 1997, and 1998. Then, for year 1998, calculate the moving average by averaging 1997, 1998, and 1999. Following that, compute the output gap as a percentage deviation from the moving average.
(b) Create a line chart to display the output gap series, with the y-axis representing the output gap and the x-axis representing the year. Fill in the y-axis title, x-axis title, and chart title, and then adjust the x-axis to display only the year (excluding the month and day).
(c) Next, construct a scatter plot with the output gap on the y-axis (vertical) and the unemployment rate on the x-axis (horizontal). Round the decimal points to no more than two, and fill in the y-axis title, x-axis title, and chart title. Determine whether there is a positive or negative relationship between the two variables. Is this in line with your expectations?
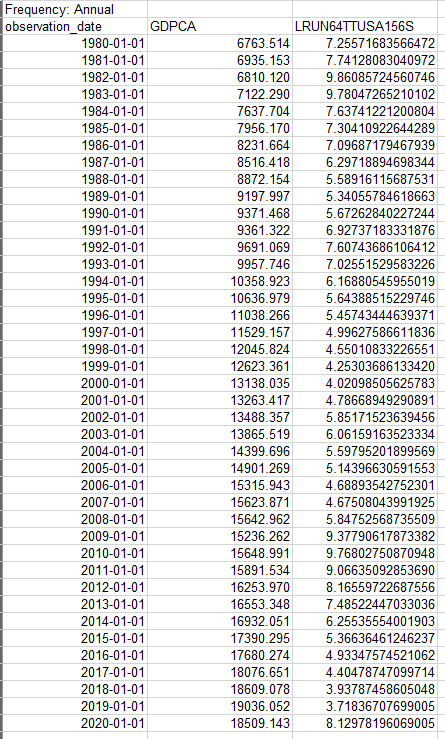
Frequency: Annual Frequency: Annual
Step by Step Solution
There are 3 Steps involved in it

Get step-by-step solutions from verified subject matter experts