

Question: a. Use Excel to create a scatter plot of the data. What does it suggest about the correlation between X and Y? b. Use Excel
a. Use Excel to create a scatter plot of the data. What does it suggest about the correlation between X and Y?
b. Use Excel to calculate the correlation coefficient.
c. Use Excel to find t.025 for a two-tailed test at = .05.
d. Calculate the t test statistic.
e. Can you reject = 0?
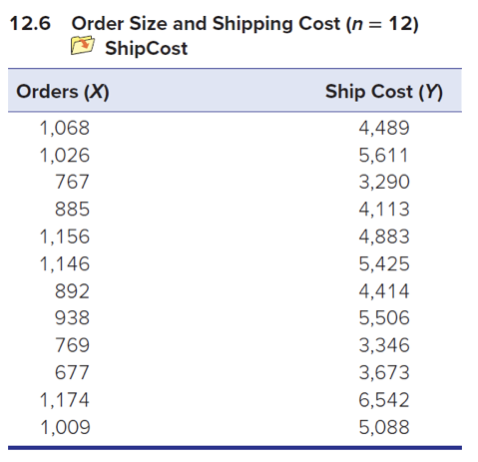
Order Size and Shipping Cost (n = 12) Ship Cost Orders (X) 1,068 1,026 767 885 1,156 1,146 892 938 769 677 1,174 1,009 Ship Cost (Y) 4,489 5,611 3,290 4,113 4,883 5,425 4,414 5,506 3,346 3,673 6,542 5,088
Step by Step Solution
There are 3 Steps involved in it
1 Expert Approved Answer
Step: 1 Unlock

Question Has Been Solved by an Expert!
Get step-by-step solutions from verified subject matter experts
Step: 2 Unlock
Step: 3 Unlock