

Question: (a) Use MATLAB to plot the function g(x) given below on a suitable interval of the x-axis. The interval should include all the zero-crossing points
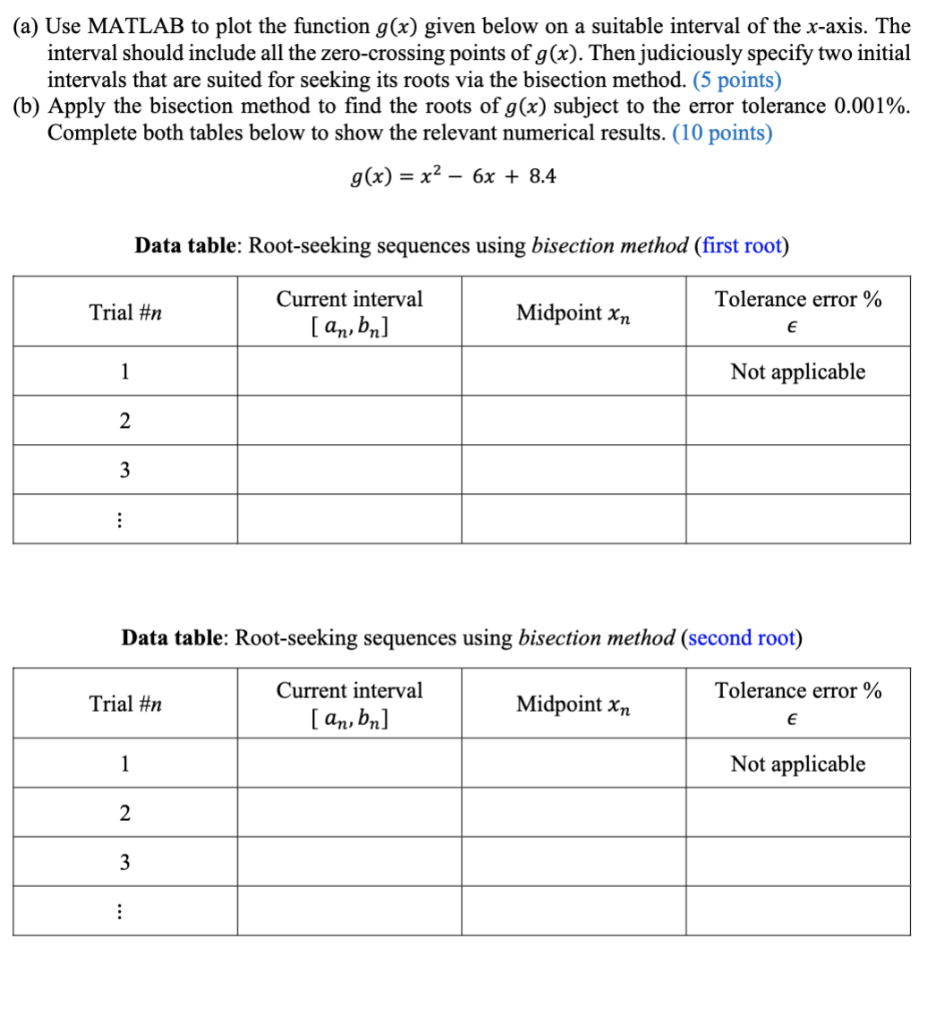
(a) Use MATLAB to plot the function g(x) given below on a suitable interval of the x-axis. The interval should include all the zero-crossing points of g(x). Then judiciously specify two initial intervals that are suited for seeking its roots via the bisection method. (5 points) (b) Apply the bisection method to find the roots of g(x) subject to the error tolerance 0.001%. Complete both tables below to show the relevant numerical results. ( 10 points) g(x)=x26x+8.4 Data table: Root-seeking sequences using bisection method (first root) Data table: Root-seeking sequences using bisection method (second root)
Step by Step Solution
There are 3 Steps involved in it
1 Expert Approved Answer
Step: 1 Unlock

Question Has Been Solved by an Expert!
Get step-by-step solutions from verified subject matter experts
Step: 2 Unlock
Step: 3 Unlock