

a. Use the observed genotype frequencies from the day 7 data to calculate the frequencies of the
Question:
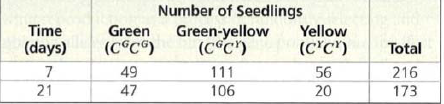
a. Use the observed genotype frequencies from the day 7 data to calculate the frequencies of the CG allele (p) and CY allele (q). (Remember that the frequency of an allele in a gene pool is the number of copies of that allele divided by the total number of copies of all alleles at that locus.
b. Next use Hardy Weinberg equation (p^2+2pg+q^2=1) to calculate expected frequencies of genotypes CGCG, CGCY, CYCY for a population in Hardy Weinberg equilibrium.
c. Calculate observed frequencies of genotypes CGCG, CGCY, CYCY at day 7. (Observed frequency of a genotype in a gene pool is the number of individuals with that genotype divided by total number of individuals). Compare these frequencies to the expected frequencies calculated in step 2. Is the seedling population in Hardy Weinberg equilibrium at day 7, or is evolution occurring? Explain reasoning and identify which genotypes appear to be selected for or against.
d. Calculate the observed frequencies of genotypes CGCG, CGCY, and CYCY at day 21. Compare frequencies to expected frequencies calculated in step b and observed frequencies at day 7. Is seedling population in Hardy Weinberg equilibrium at day 21 or is evolution occurring? Explain reasoning and identify which genotypes appear to be selected for or against.
e. Homozygous CYCY individuals cannot produce chlorophyll. The ability to photosynthesize becomes more critical as seedlings age and begin to exhaust the supply of food stored in seed from which they emerged. Develop a hypothesis that explains data for days 7 and 21. Based on this hypothesis predict how frequencies of CG and CY alleles will change beyond day 21.
Expert Answer:
a Each individual has two alleles so the total number of alleles at day 7 is 216 x 2 432 To calculat... View the full answer


Accounting What the Numbers Mean
ISBN: 978-0078025297
10th edition
Authors: David H. Marshall, Wayne W. McManus, Daniel F. Viele
