

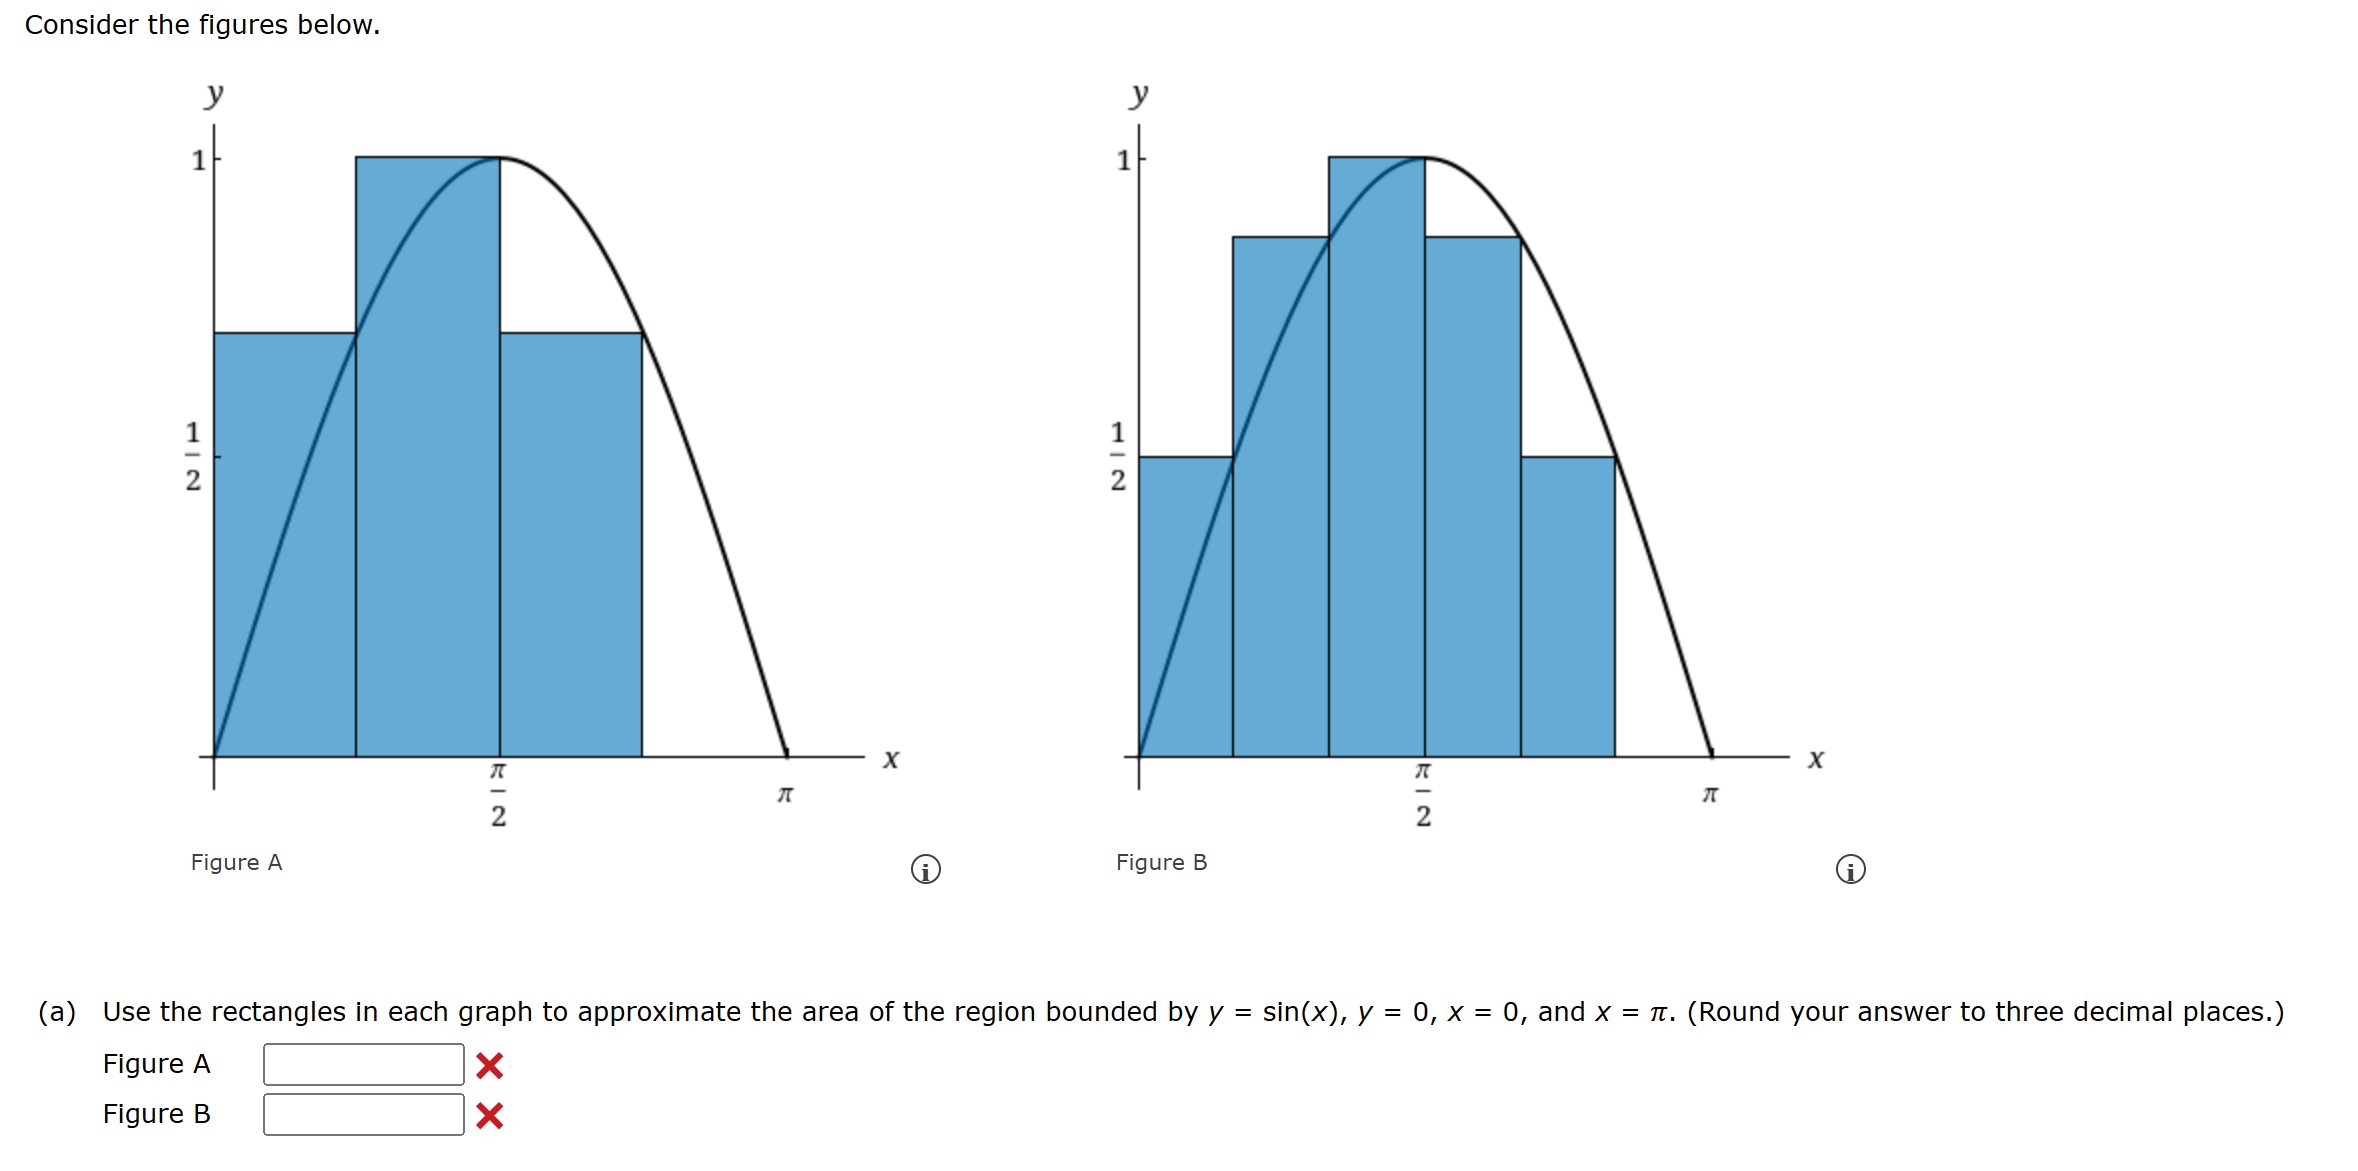
Question: ( a ) Use the rectangles i n each graph t o approximate the area o f the region bounded b y y = s
Use the rectangles each graph approximate the area the region bounded and your answer three decimal places. Figure A Figure Describe how you could continue this process obtain a more accurate approximation the area. Continually increase the number rectangles. Continually decrease the height all rectangles. Continually decrease the number rectangles. Continually increase the height all rectangles.
Consider the figures below.
Use the rectangles each graph approximate the area the region bounded and your answer three decimal places.
Figure
Figure
Step by Step Solution
There are 3 Steps involved in it
1 Expert Approved Answer
Step: 1 Unlock

Question Has Been Solved by an Expert!
Get step-by-step solutions from verified subject matter experts
Step: 2 Unlock
Step: 3 Unlock