

Question: a) Use the TREND function to fit a linear trend model to the data (call this column Estimated Sales). b. Prepare a line graph comparing
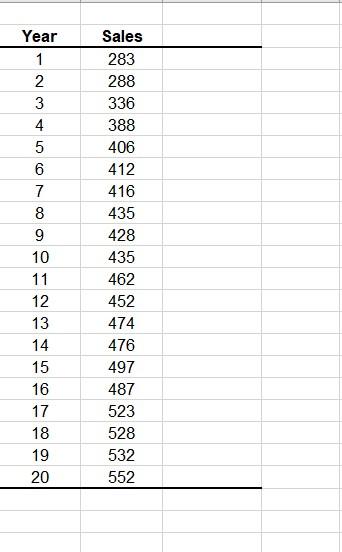
a) Use the TREND function to fit a linear trend model to the data (call this column Estimated Sales).
b. Prepare a line graph comparing the linear trend predictions against the original data.
c. Use the Regression command to run a regression analysis. Save the regression results to a new ply called Q3 Regression (linear) added after Q3.
d. On the Q3 Regression (linear) worksheet, write out the estimated regression function.
e. Compute forecasts for the next two years using this technique (i.e., use TREND).
\begin{tabular}{|c|c|c|} \hline Year & Sales \\ \hline 1 & 283 \\ \hline 2 & 288 \\ \hline 3 & 336 \\ \hline 4 & 388 \\ \hline 5 & 406 & \\ \hline 6 & 412 & \\ \hline 7 & 416 \\ \hline 8 & 435 \\ \hline 9 & 428 \\ \hline 10 & 435 \\ \hline 11 & 462 \\ \hline 12 & 452 \\ \hline 13 & 474 \\ \hline 14 & 476 \\ \hline 15 & 497 \\ \hline 16 & 487 \\ \hline 17 & 523 \\ \hline 18 & 528 \\ \hline 19 & 532 \\ \hline 20 & 552 \\ \hline \end{tabular}
Step by Step Solution
There are 3 Steps involved in it

Get step-by-step solutions from verified subject matter experts