

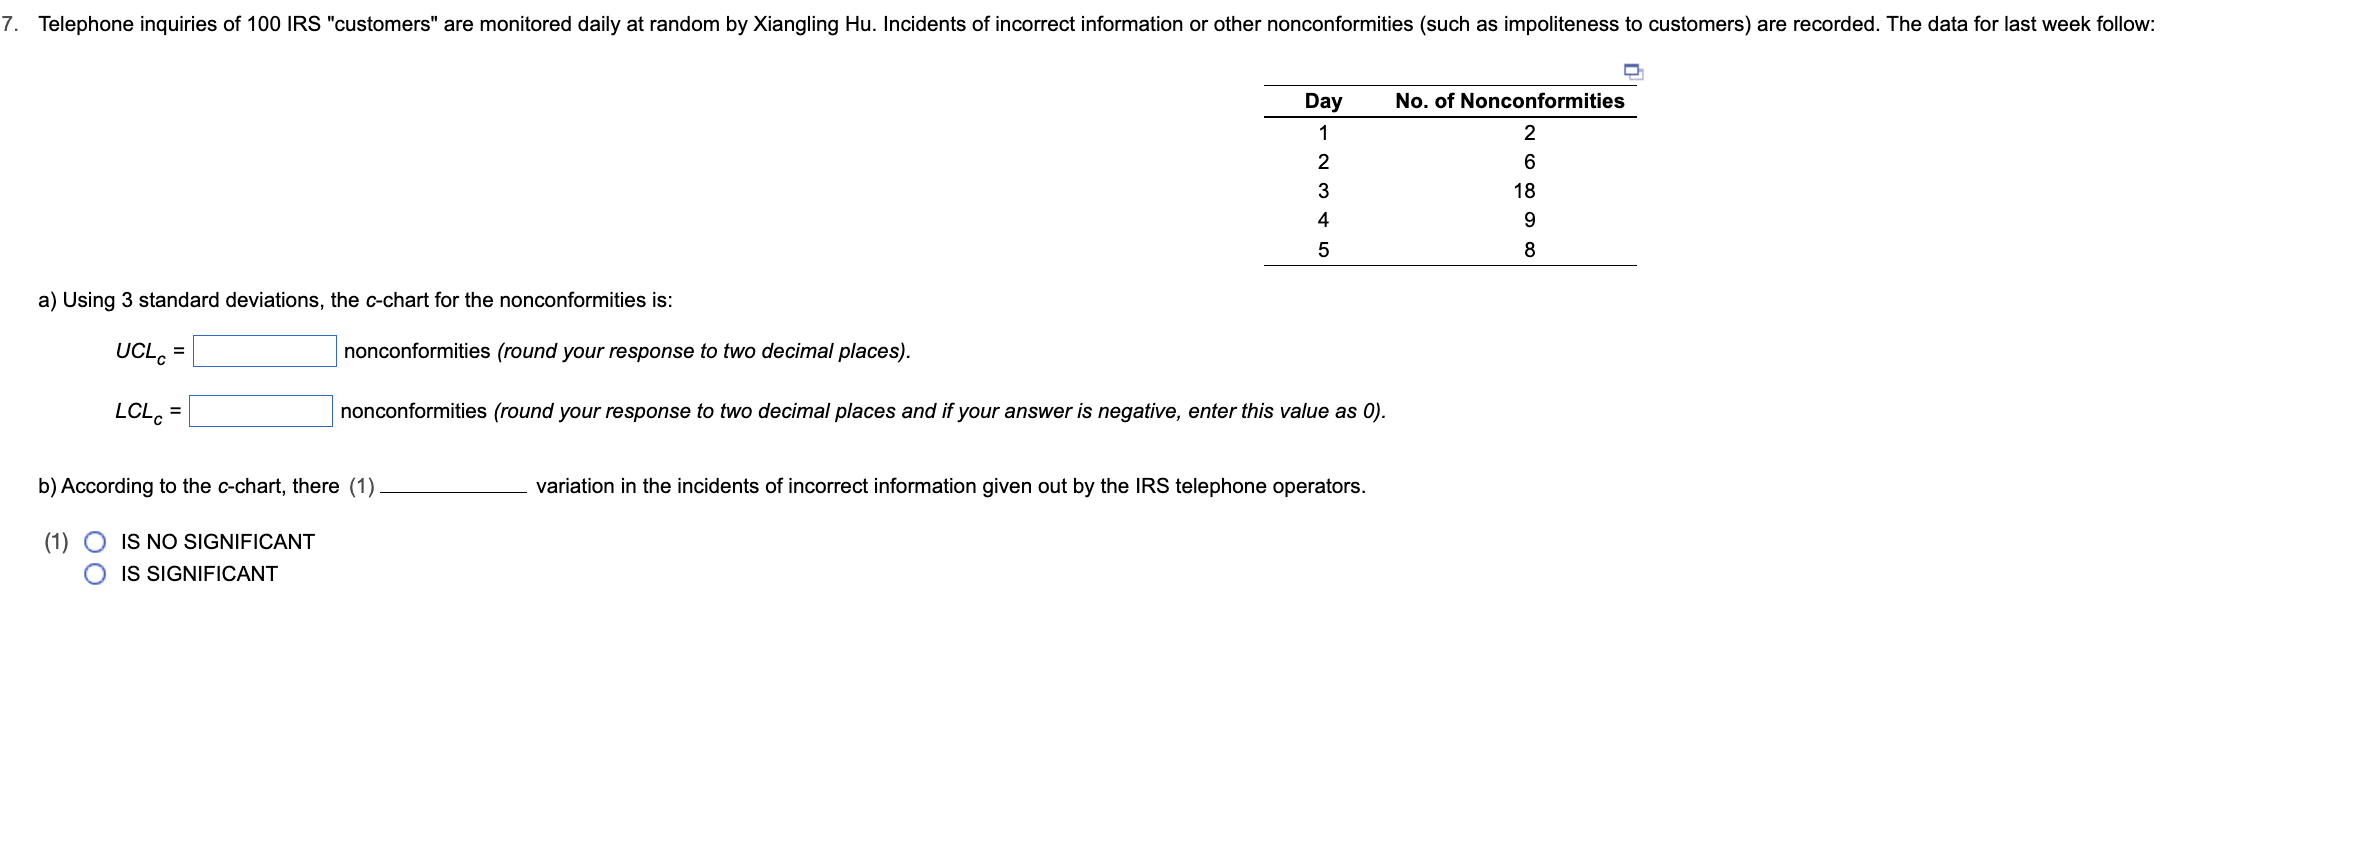
Question: a) Using 3 standard deviations, the c-chart for the nonconformities is: UCLc= nonconformities (round your response to two decimal places). LCLc= nonconformities (round your response
Step by Step Solution
There are 3 Steps involved in it
1 Expert Approved Answer
Step: 1 Unlock

Question Has Been Solved by an Expert!
Get step-by-step solutions from verified subject matter experts
Step: 2 Unlock
Step: 3 Unlock