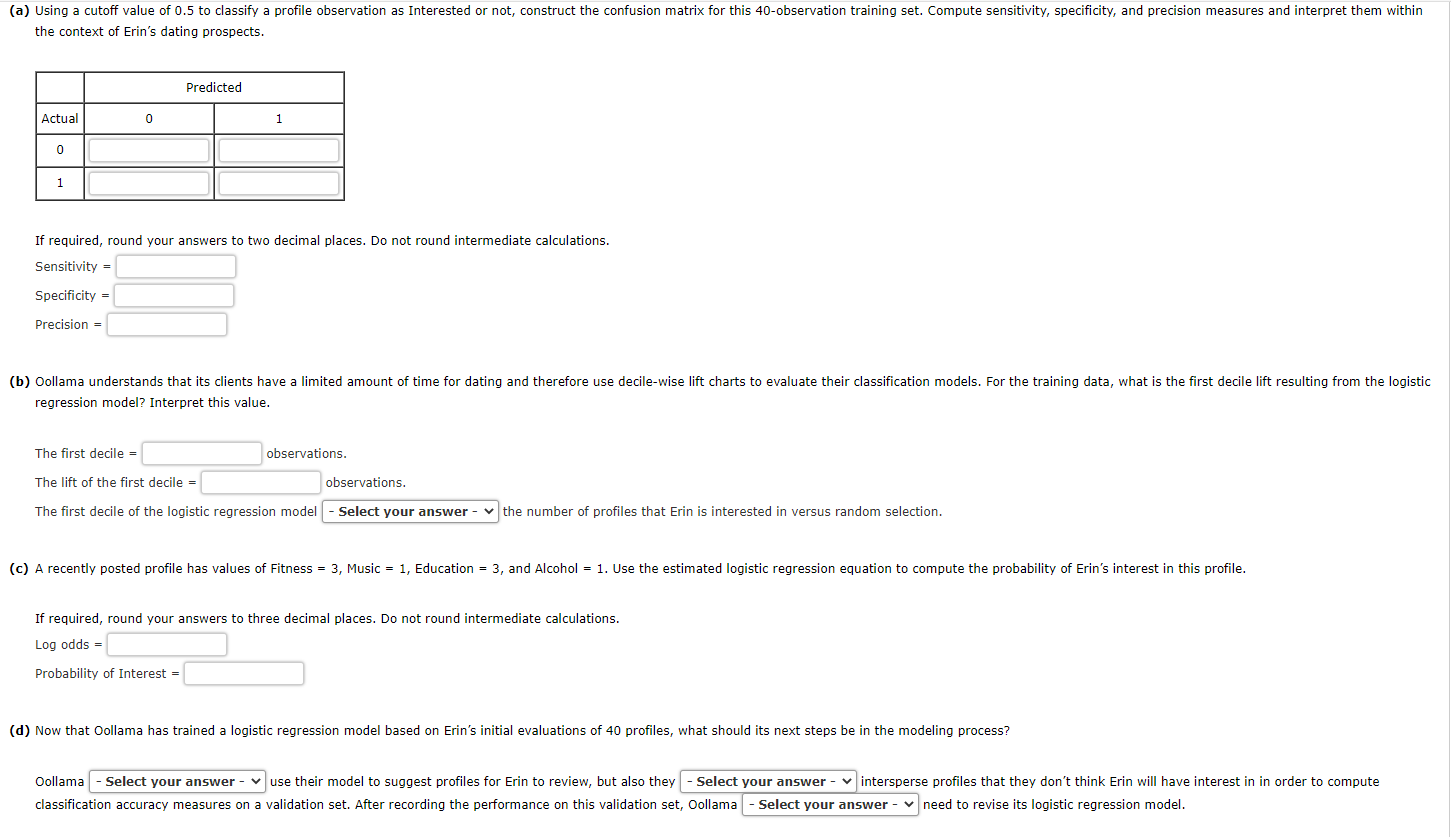
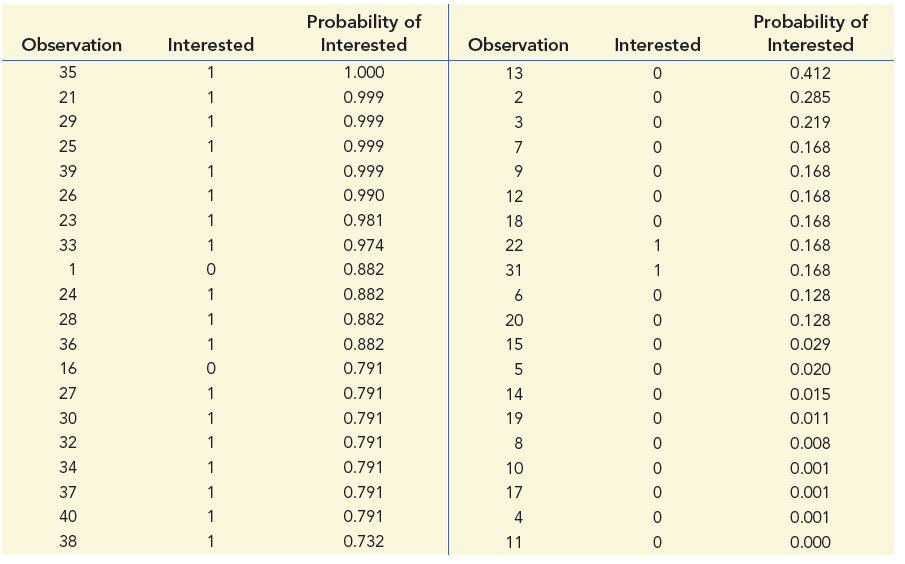
Question: (a) Using a cutoff value of 0.5 to classify a profile observation as Interested or not, construct the confusion matrix for this 40-observation training set.

(a) Using a cutoff value of 0.5 to classify a(a) Using a cutoff value of 0.5 to classify a

(a) Using a cutoff value of 0.5 to classify a profile observation as Interested or not, construct the confusion matrix for this 40-observation training set. Compute sensitivity, specificity, and precision measures and interpret them within the context of Erin's dating prospects. Predicted Actual 0 1 0 1 If required, round your answers to two decimal places. Do not round intermediate calculations. Sensitivity = Specificity = Precision = (b) Oollama understands that its clients have a limited amount of time for dating and therefore use decile-wise lift charts to evaluate their classification models. For the training data, what is the first decile lift resulting from the logistic regression model? Interpret this value. The first decile = observations. The lift of the first decile = observations. The first decile of the logistic regression model Select your answer the number of profiles that Erin is interested in versus random selection. (c) A recently posted profile has values of Fitness = 3, Music = 1, Education = 3, and Alcohol = 1. Use the estimated logistic regression equation to compute the probability of Erin's interest in this profile. If required, round your answers to three decimal places. Do not round intermediate calculations. Log odds = Probability of Interest = (d) Now that Oollama has trained a logistic regression model based on Erin's initial evaluations of 40 profiles, what should its next steps be in the modeling process? Oollama - Select your answer use their model to suggest profiles for Erin to review, but also they Select your answer - intersperse profiles that they don't think Erin will have interest in in order to compute classification accuracy measures on a validation set. After recording the performance on this validation set, Oollama Select your answer - need to revise its logistic regression model. Interested Observation Observation 35 13 Interested 0 0 1 1 1 21 2 3 0 7 0 1 1 1 9 29 25 39 26 23 33 0 0 1 0 1 1 1 1 0 Probability of Interested 1.000 0.999 0.999 0.999 0.999 0.990 0.981 0.974 0.882 0.882 0.882 0.882 0.791 0.791 0.791 0.791 0.791 0.791 0.791 0.732 12 18 22 31 6 20 15 Probability of Interested 0.412 0.285 0.219 0.168 0.168 0.168 0.168 0.168 0.168 0.128 0.128 0.029 0.020 0.015 0.011 0.008 0.001 0.001 0.001 0.000 24 1 0 1 0 1 0 28 36 16 27 0 5 1 0 0 0 30 32 1 1 0 34 1 1 14 19 8 10 17 4 11 37 40 38 0 0 0 1 1 0

Step by Step Solution

There are 3 Steps involved in it

1 Expert Approved Answer
Step: 1 Unlock blur-text-image
Question Has Been Solved by an Expert!

Get step-by-step solutions from verified subject matter experts

Step: 2 Unlock
Step: 3 Unlock

Students Have Also Explored These Related General Management Questions!