

Question: (a) Using all the data find trial control limits for X and R charts. Round your answers to 2 decimal places (e.g. 98.76). X Control
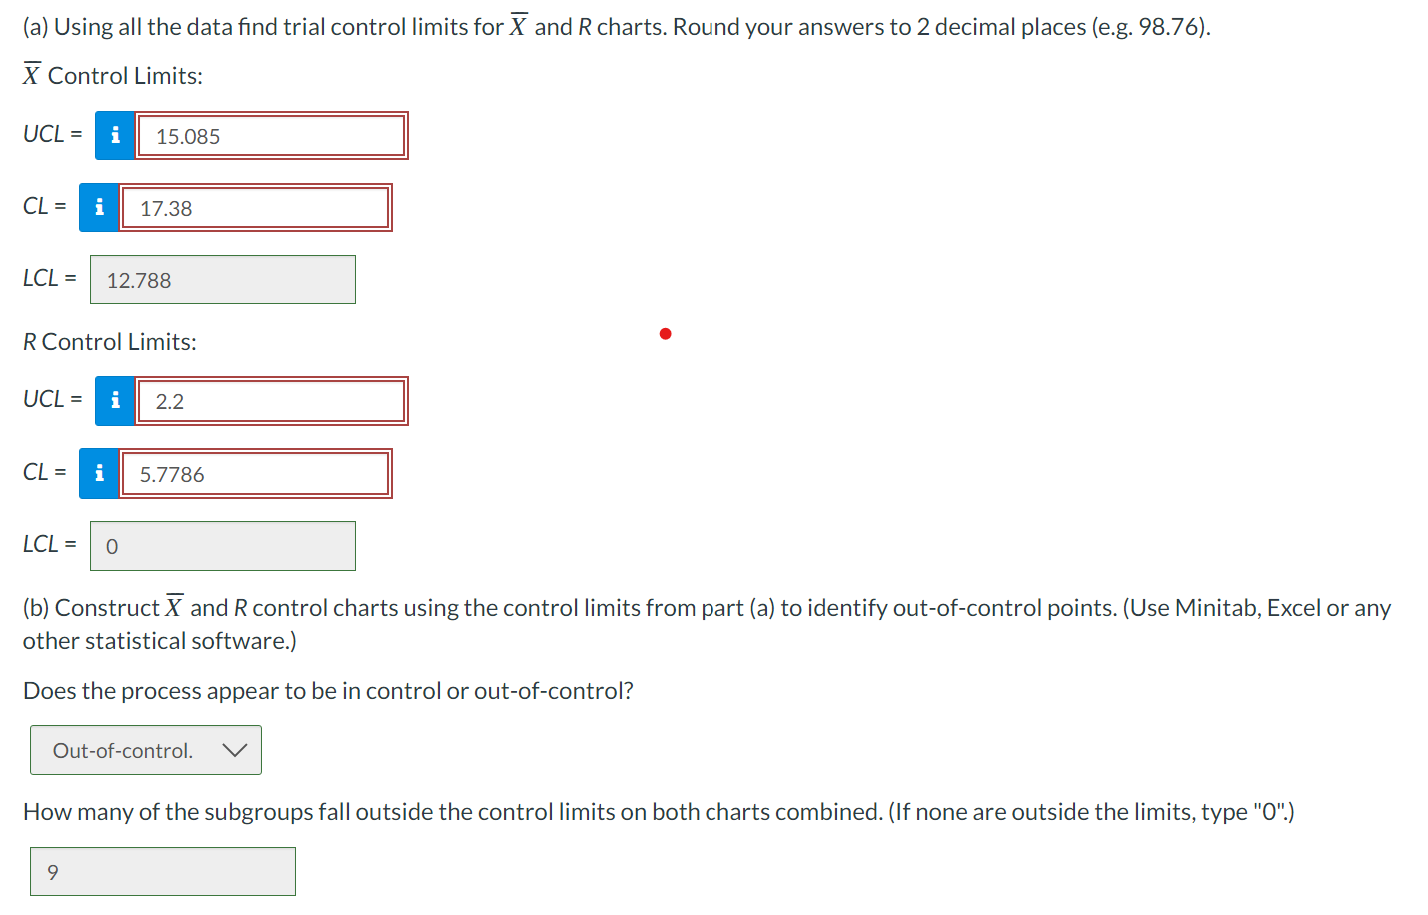
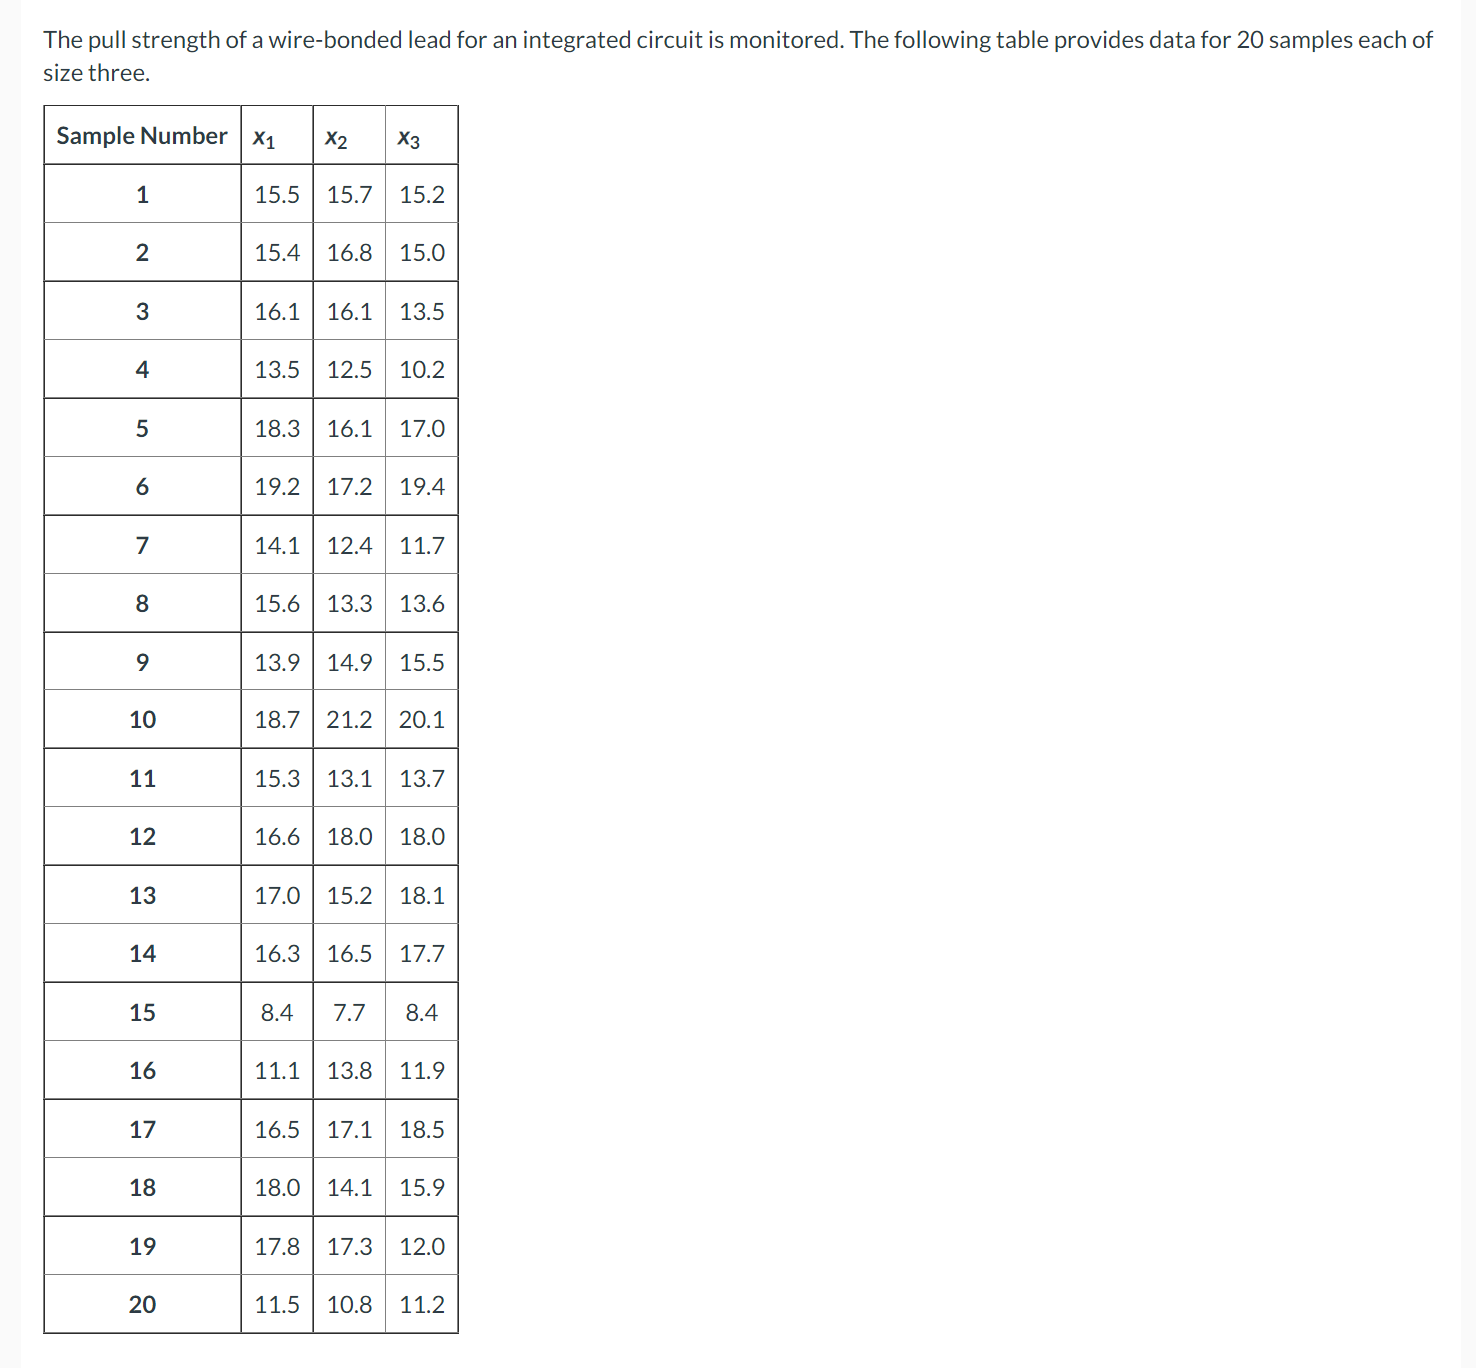
(a) Using all the data find trial control limits for X and R charts. Round your answers to 2 decimal places (e.g. 98.76). X Control Limits: UCL = 15.085 CL = 17.38 LCL = 12.788 R Control Limits: UCL = 2.2 CL = 5.7786 LCL = 0 (b) Construct X and R control charts using the control limits from part (a) to identify out-of-control points. (Use Minitab, Excel or any other statistical software.) Does the process appear to be in control or out-of-control? Out-of-control. How many of the subgroups fall outside the control limits on both charts combined. (If none are outside the limits, type "0".) 9The pull strength 0 size three. a wire-bonded lead Sample Number x1 x2 x3 1 15.5 15.7 15.2 2 15.4 16.8 15.0 3 16.1 16.1 13.5 4 13.5 12.5 10.2 5 18.3 16.1 17.0 6 19.2 17.2 19.4 7 14.1 12.4 1 1.7 8 15.6 13.3 13.6 9 13.9 14.9 15.5 10 18.7 21.2 20.1 11 15.3 13.1 13.7 12 16.6 18.0 18.0 13 17.0 15.2 18.1 14 16.3 16.5 17.7 15 8.4 7.7 8.4 16 11.1 13.8 1 1.9 17 16.5 17.1 18.5 18 18.0 14.1 15.9 19 17.8 17.3 12.0 20 11.5 10.8 1 1.2 or an integrated circuit is monitored. Thefollowingtable provides data for 20 samples each of
Step by Step Solution
There are 3 Steps involved in it

Get step-by-step solutions from verified subject matter experts