

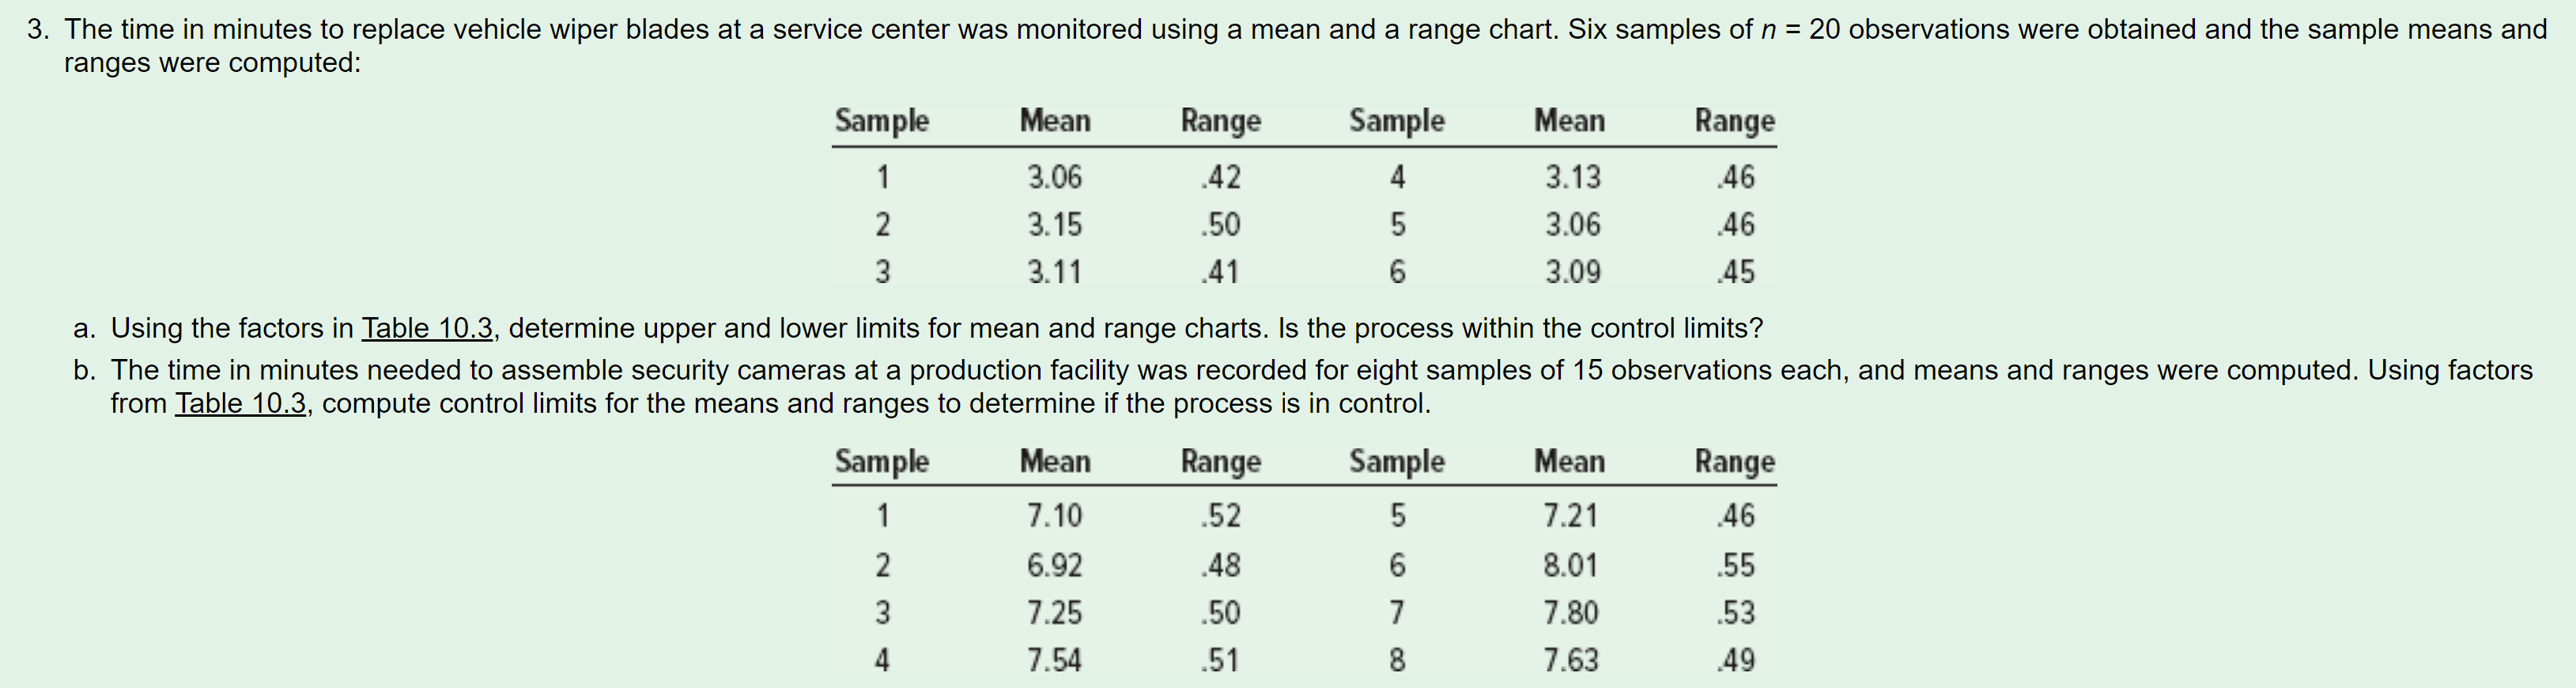
Question: a. Using the factors in Table 10.3, determine upper and lower limits for mean and range charts. Is the process within the control limits? from
Step by Step Solution
There are 3 Steps involved in it
1 Expert Approved Answer
Step: 1 Unlock

Question Has Been Solved by an Expert!
Get step-by-step solutions from verified subject matter experts
Step: 2 Unlock
Step: 3 Unlock