

Question: A. Using the High-Low Method, determine the total amount of Fixed cost and the Total amount of variable cost per unit. Draw the Cost line
A. Using the High-Low Method, determine the total amount of Fixed cost and the Total amount of variable cost per unit. Draw the Cost line
B. Prepare a Scatter Diagram, plot the Actual Costs, and Visually Fit a Linear Cost Line to the points. Estimate the amount of Total fixed cots and the variable costs per unit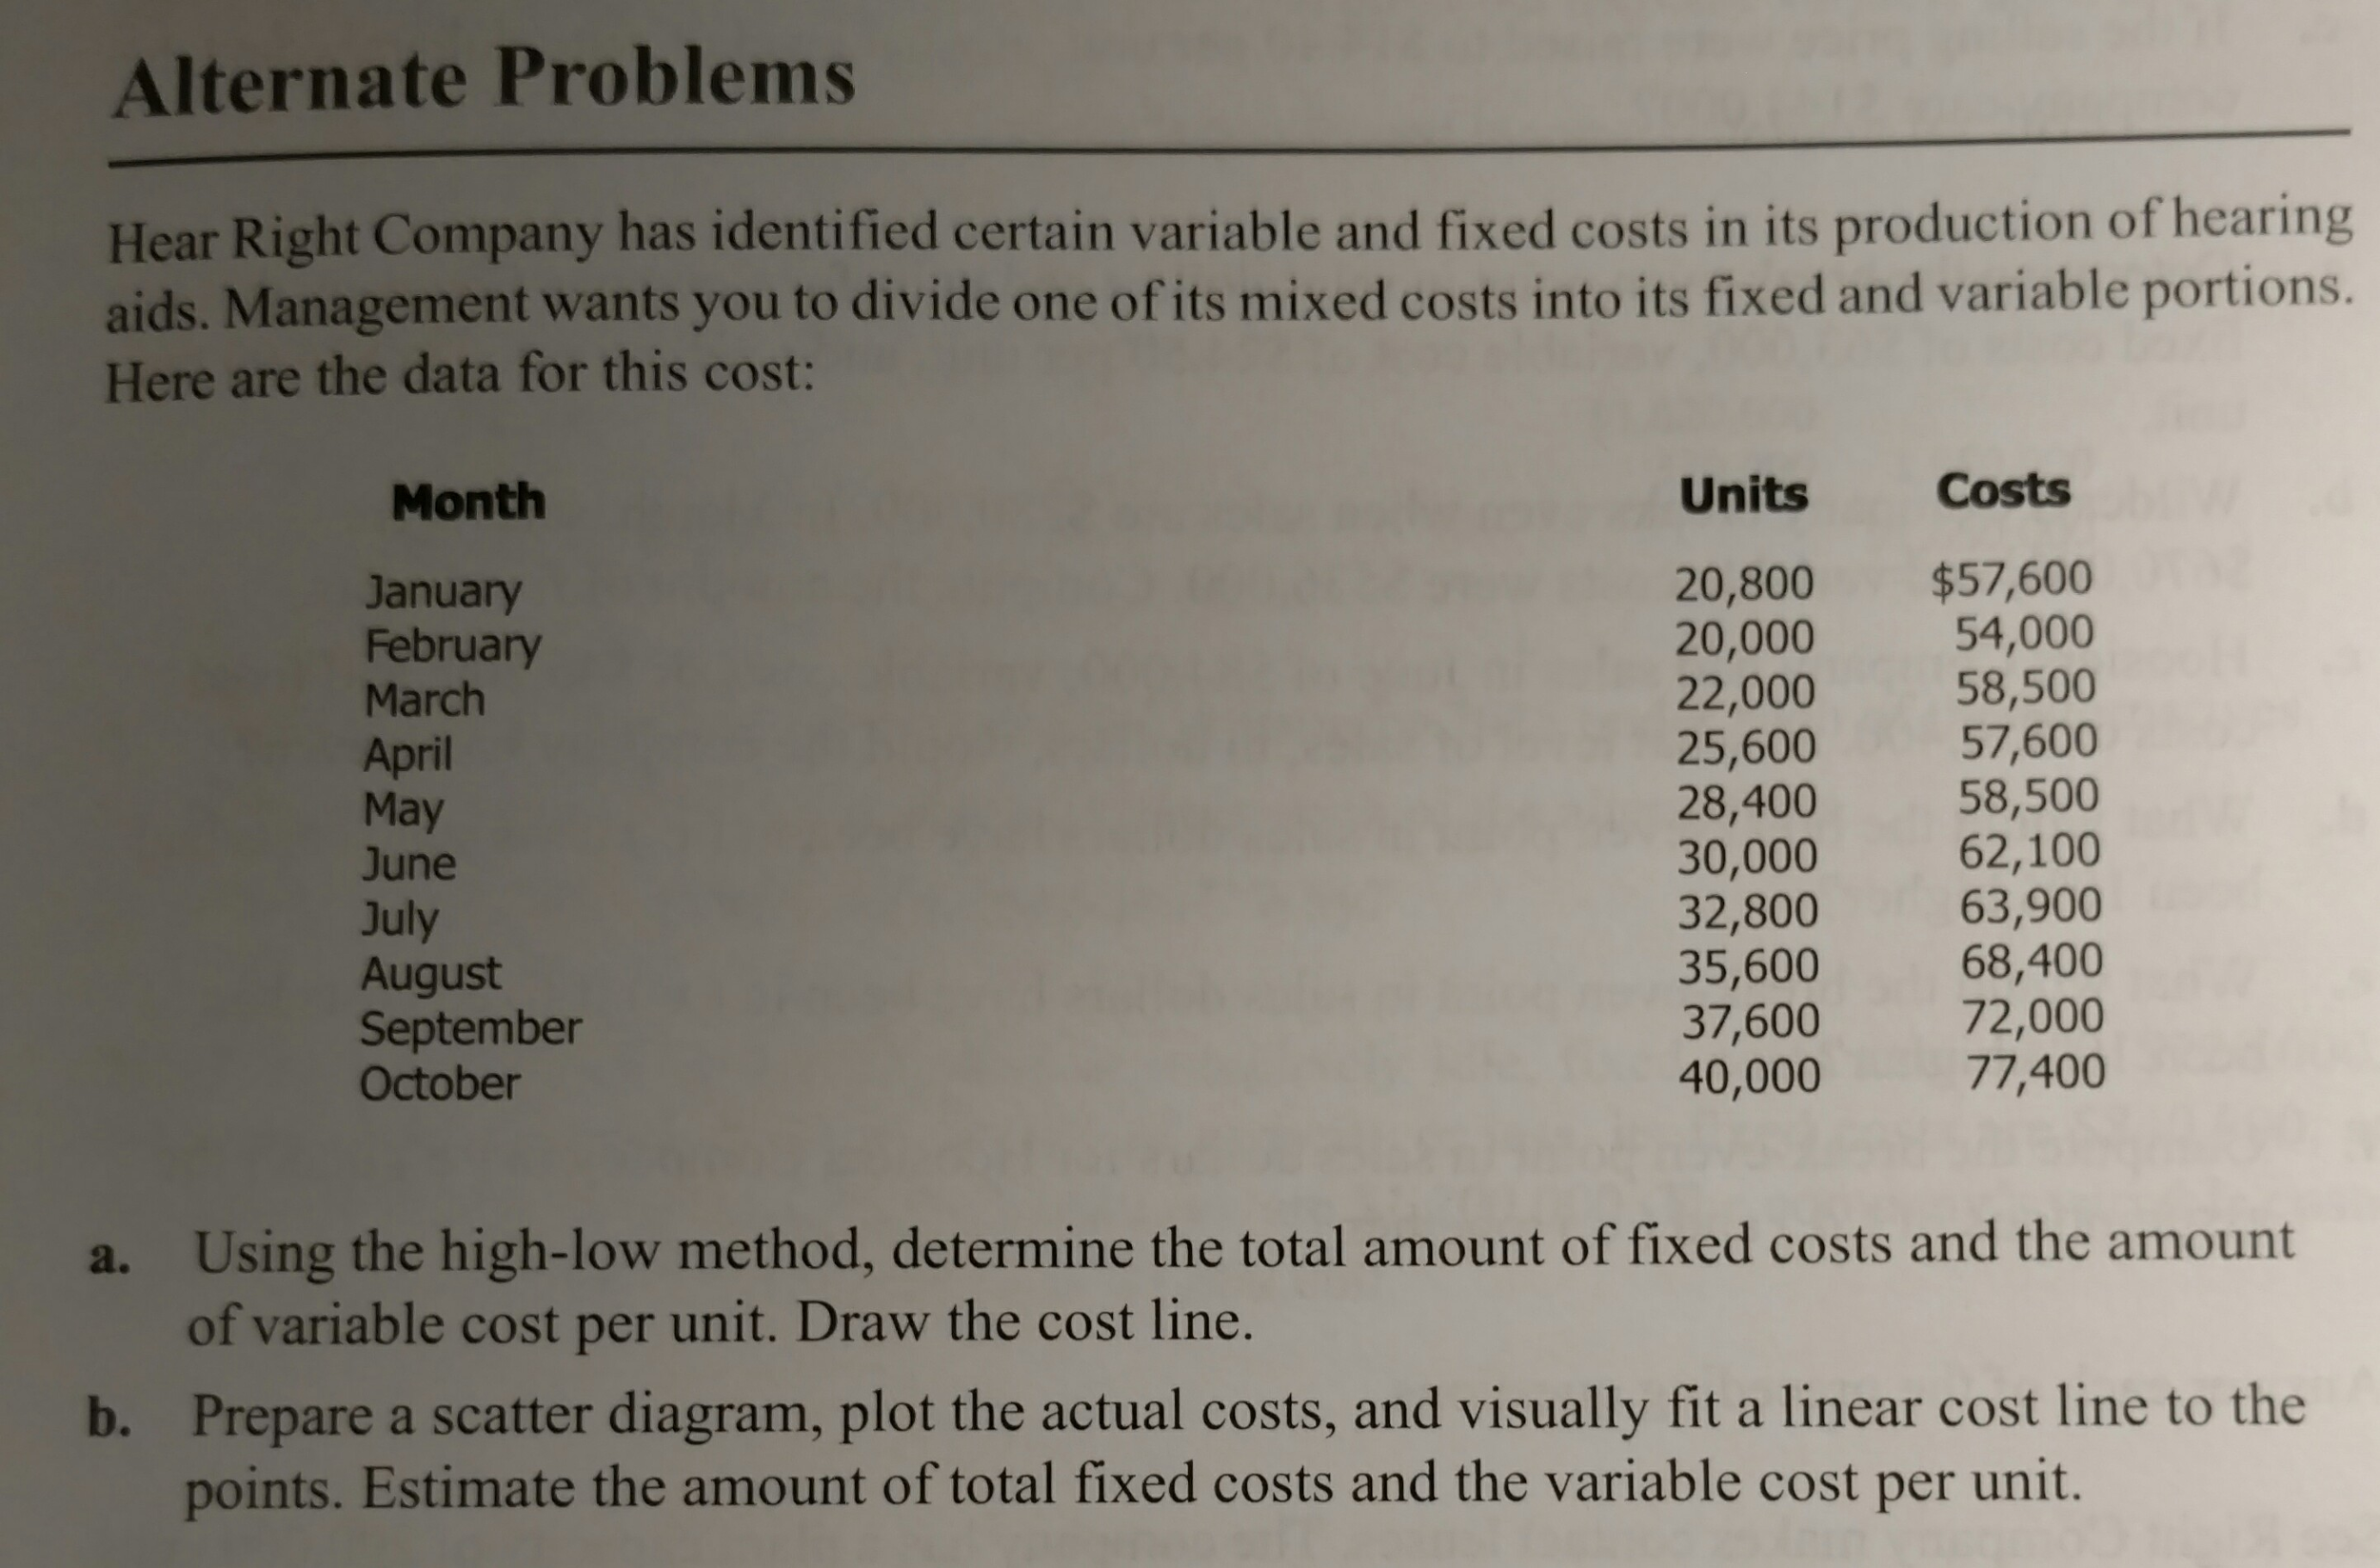
(Part A): I've already calculated the Fixed cost and the Variable Cost Per Units. However im not sure what its asking about the cost line. Does it want me to just show what a basic outline of a Fixed Graph and Variable Graph looks like?
(Part B): I've prepared a scatter diagram using the given information and ive created a Linear Trend line (what i assume is a Linear Cost Line) However i am not sure how to estimate the amount of total fixed costs and the variable Costs per unit.
We have to have everything included in an Excel document
Step by Step Solution
There are 3 Steps involved in it

Get step-by-step solutions from verified subject matter experts