

Question: a. Using the time series in Table 2, calculate the 4-year simple moving average forecast for 2013. b. For the data in Table 2, calculate
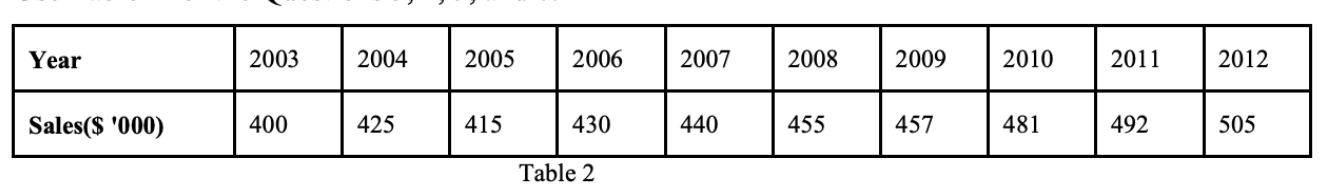
a. Using the time series in Table 2, calculate the 4-year simple moving average forecast for 2013.
b. For the data in Table 2, calculate a 6-year weighted moving average forecast for 2013, using the following weights: 0.1, 0.1, 0.1, 0.2, 0.2, and 0.3 from the oldest to the most recent year.
c. Using an of 0.25, calculate the 2013 forecasting using the simple exponential smoothing model. Use the data given in Table 2 and assume a 2012 forecast of $500,000.
d. Using = 0.25 and = 0.1, calculate the demand forecast for the years 2009 to 2013. Assume a 2008 forecast of 422. Which value of gives a better forecast? (Hint: Calculate the MSE of forecast for the periods 2009 to 2012).
Year 2003 2004 2005 2006 | 2007 2008 2009 2010 2011 2012 Sales($ '000) 400 425 415 430 440 455 457 481 492 505 Table 2Step by Step Solution
There are 3 Steps involved in it

Get step-by-step solutions from verified subject matter experts