

Question: a) Using this information, construct control limits for the x-chart mph (round your response to three decimal places). UCL LCL mph (round your response
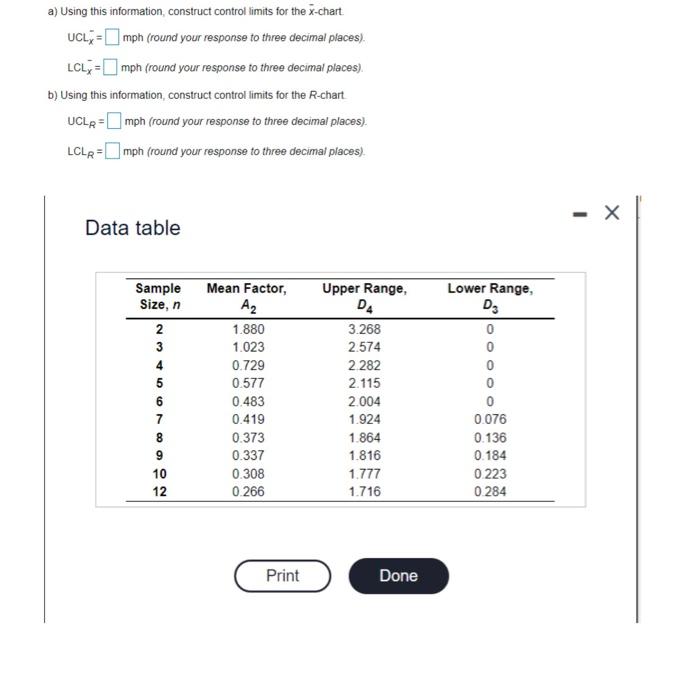
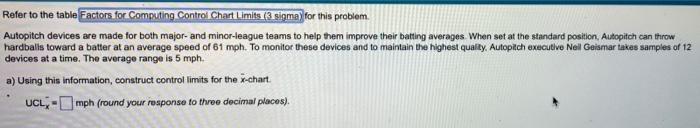
a) Using this information, construct control limits for the x-chart mph (round your response to three decimal places). UCL LCL mph (round your response to three decimal places). b) Using this information, construct control limits for the R-chart UCLR= mph (round your response to three decimal places). LCLR= mph (round your response to three decimal places). Data table - Sample Mean Factor, Size, n A2 Upper Range, D4 Lower Range, D3 2 1.880 3.268 0 3 1.023 2.574 0 4 0.729 2.282 5 0.577 2.115 0 6 0.483 2.004 0 7 0.419 1.924 0.076 8 0.373 1.864 0.136 9 0.337 1.816 0.184 120 0.308 1.777 0.223 0.266 1.716 0.284 Print Done
Step by Step Solution
There are 3 Steps involved in it

Get step-by-step solutions from verified subject matter experts