

Question: (a) Visualize the similarity graph (you can either show the adjacency matrix, or similar to the lecture slides, visualize the graph using graph visualization packages
(a) Visualize the similarity graph (you can either show the adjacency matrix, or similar to the lecture slides, visualize the graph using graph visualization packages such as Gaphi (https://gephi.org) and illustrate a few images corresponds to nodes at different parts of the graph, e.g., mark them by hand or use software packages).
Implement the ISOMAP algorithm yourself to obtain a two-dimensional low-dimensional embedding. Plot the embeddings using a scatter plot, similar to the plots in lecture slides. Find a few images in the embedding space and show what these images look like. Comment on do you see any visual similarity among them and their arrangement, similar to what you seen in the paper?
(c) Now choose `1 distance (or Manhattan distance) between images (recall the definition from "Clustering" lecture)). Repeat the steps above. Use -ISOMAP to obtain a k = 2 dimensional embedding. Present a plot of this embedding. Do you see any difference by choosing a different similarity measure by comparing results in Part (b) and Part (c)?
(d) Perform PCA (you can now use your implementation written in Question 1) on the images and project them into the top 2 principal components. Again show them on a scatter plot. Explain whether or you see a more meaningful projection using ISOMAP than PCA
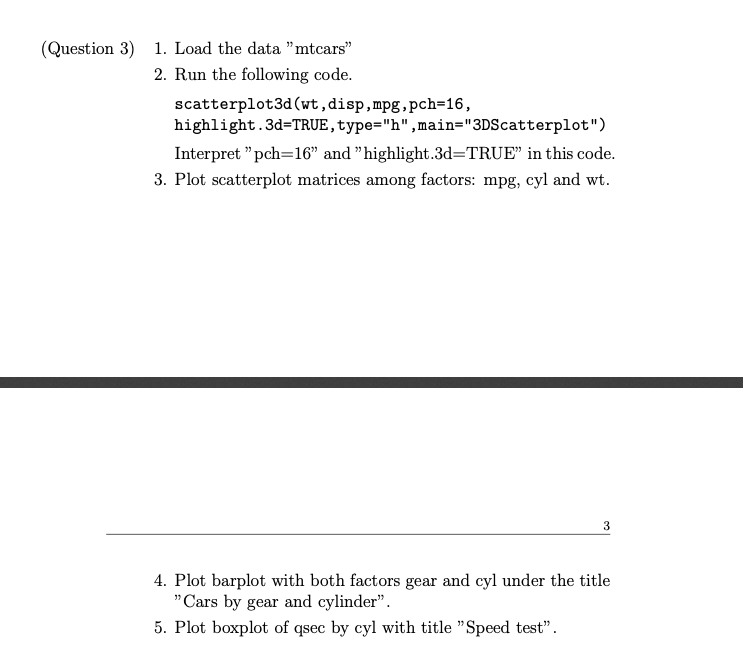
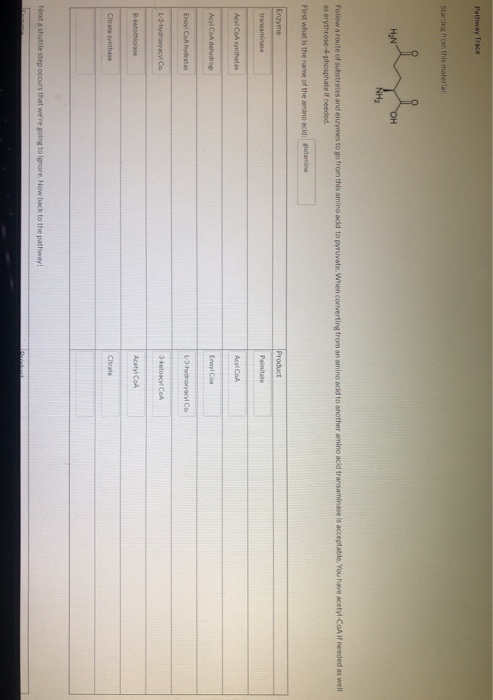
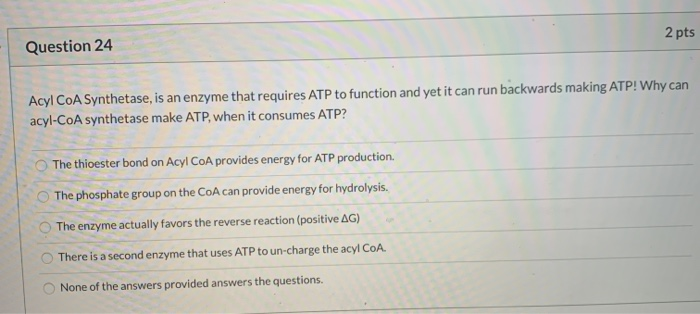
(Question 3) 1. Load the data "mtcars" 2. Run the following code. scatterplot3d (wt , disp, mpg , pch=16, highlight . 3d=TRUE, type="h" , main="3DScatterplot") Interpret "pch=16" and "highlight.3d=TRUE" in this code. 3. Plot scatterplot matrices among factors: mpg, cyl and wt. 3 4. Plot barplot with both factors gear and cyl under the title "Cars by gear and cylinder" 5. Plot boxplot of qsec by cyl with title "Speed test".Pathway Trace Starting from this material: OH NH: Follow a route of substrates and enzymes to go from this amino acid to pyruvate. When converting from an amino acid to another amino acid transaminase is acceptable. You have acetyl-Con If needed as well as erythrose-4-phosphate if needed. First what is the name of the amino acid: glutamine Enzyme Product transaminand Acyl Con Inthetan Acyl Cod dehydrog Frapl Cas Eroyl Col hydrates B.butothiolase AcetylCeA Citrate venthing Next a shuttle step occurs that we're going to Ignore. Now back to the pathway!3.1 Within a lease agreement an important principle exists protecting the right of the tenant to use and enjoyment of the leased property in the event of a change in ownership. Elaborate on this principle and its implications. (10) 3.4 Itemize the types of Intellectual Property recognised in South African legislation today. (8) IQuestion 24 2 pts Acyl CoA Synthetase, is an enzyme that requires ATP to function and yet it can run backwards making ATP! Why can acyl-CoA synthetase make ATP, when it consumes ATP? The thioester bond on Acyl CoA provides energy for ATP production. O The phosphate group on the CoA can provide energy for hydrolysis. O The enzyme actually favors the reverse reaction (positive AG) O There is a second enzyme that uses ATP to un-charge the acyl CoA. O None of the answers provided answers the questions
Step by Step Solution
There are 3 Steps involved in it

Get step-by-step solutions from verified subject matter experts