

Question: A ... wait Module 4 Part 1 Challenge Problem: 8.42 Page 339 Helmets and lunches. The scatterplot shows the relationship between socioeconomic status measured as
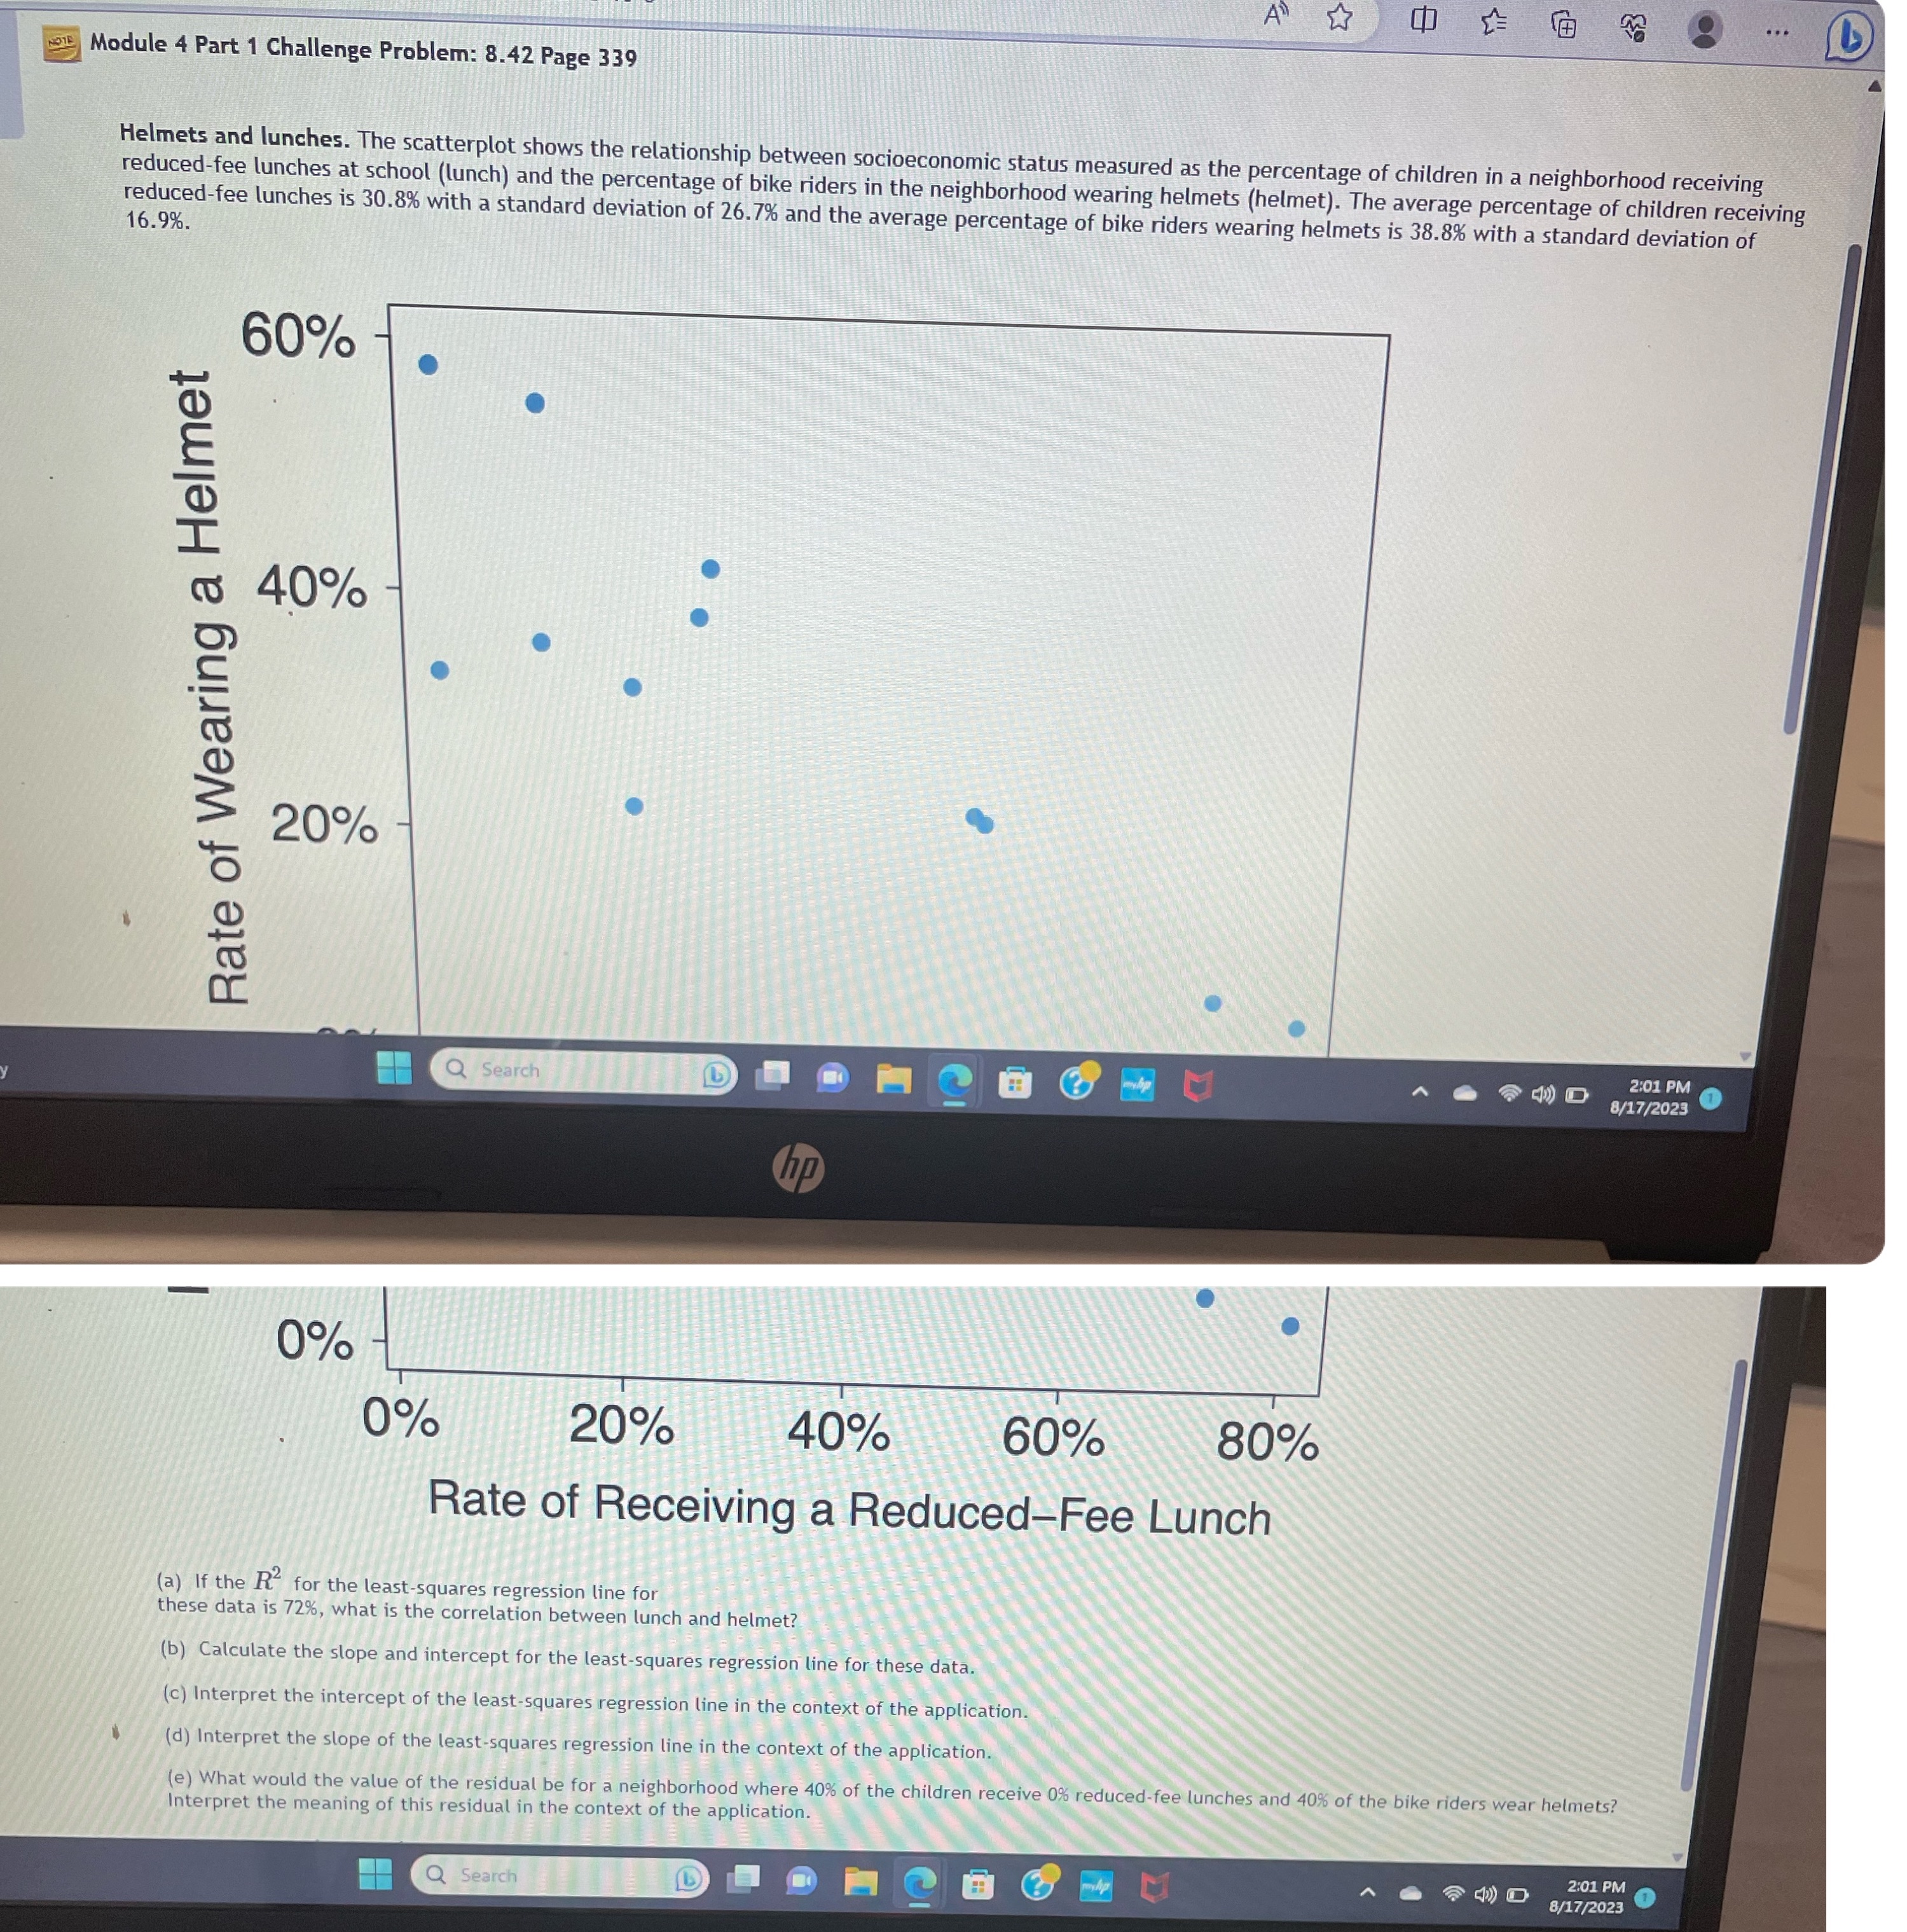
A ... wait Module 4 Part 1 Challenge Problem: 8.42 Page 339 Helmets and lunches. The scatterplot shows the relationship between socioeconomic status measured as the percentage of children in a neighborhood receiving reduced-fee lunches at school (lunch) and the percentage of bike riders in the neighborhood wearing helmets (helmet). The average percentage of children receiving reduced-fee lunches is 30.8% with a standard deviation of 26.7% and the average percentage of bike riders wearing helmets is 38.8% with a standard deviation of 16.9%. 60% 40% . Rate of Wearing a Helmet 20% Q Search 2:01 PM 8/17/2023 hp 0% 0% 20% 40% 60% 80% Rate of Receiving a Reduced-Fee Lunch a) If the R for the least-squares regression line for these data is 72%, what is the correlation between lunch and helmet? (b) Calculate the slope and intercept for the least-squares regression line for these data. (c) Interpret the intercept of the least-squares regression line in the context of the application. (d) Interpret the slope of the least-squares regression line in the context of the application. (e) What would the value of the residual be for a neighborhood where 40% of the children receive 0% reduced-fee lunches and 40% of the bike riders wear helmets? Interpret the meaning of this residual in the context of the application. M 2:01 PM Q Search 8/17/2023
Step by Step Solution
There are 3 Steps involved in it

Get step-by-step solutions from verified subject matter experts