

Question: a) what is the fitted model from the table? b) what is the estimate of error variance? c) conduct a hypothesis testing to test whether
a) what is the fitted model from the table?
b) what is the estimate of error variance?
c) conduct a hypothesis testing to test whether the crime rate depends on the percentage of high school diploma. Clearly write out the null and alternative hypotheses and how to reach the conclusion?
d) Test at 1% level the following hypothesis testing problem:  vs
vs 
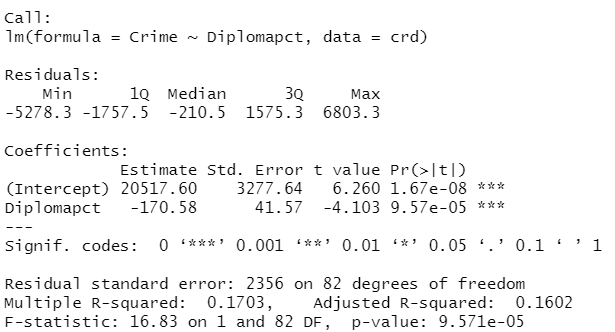
Ca11 : 1m( formula = crime Diplomapct, data = crd) Recidualc. Coefficients: Estimate std. Error t value Pr(>t) (Intercept)Diplomapct20517.60170.583277.6441.576.2604.1031.67e089.57e05kkk Diplomapct 170.5841.574.1039.57e05 * Signif. codes: 0 ' kk,0.001 ' kk,0.01 ' k,0.05 '.' 0.1 ' , 1 Residual standard error: 2356 on 82 degrees of freedom Mu7tiple R-squared: 0.1703, Adjusted R-squared: 0.1602 F-statistic: 16.83 on 1 and 82 DF, p-value: 9.571e-05
Step by Step Solution
There are 3 Steps involved in it

Get step-by-step solutions from verified subject matter experts