

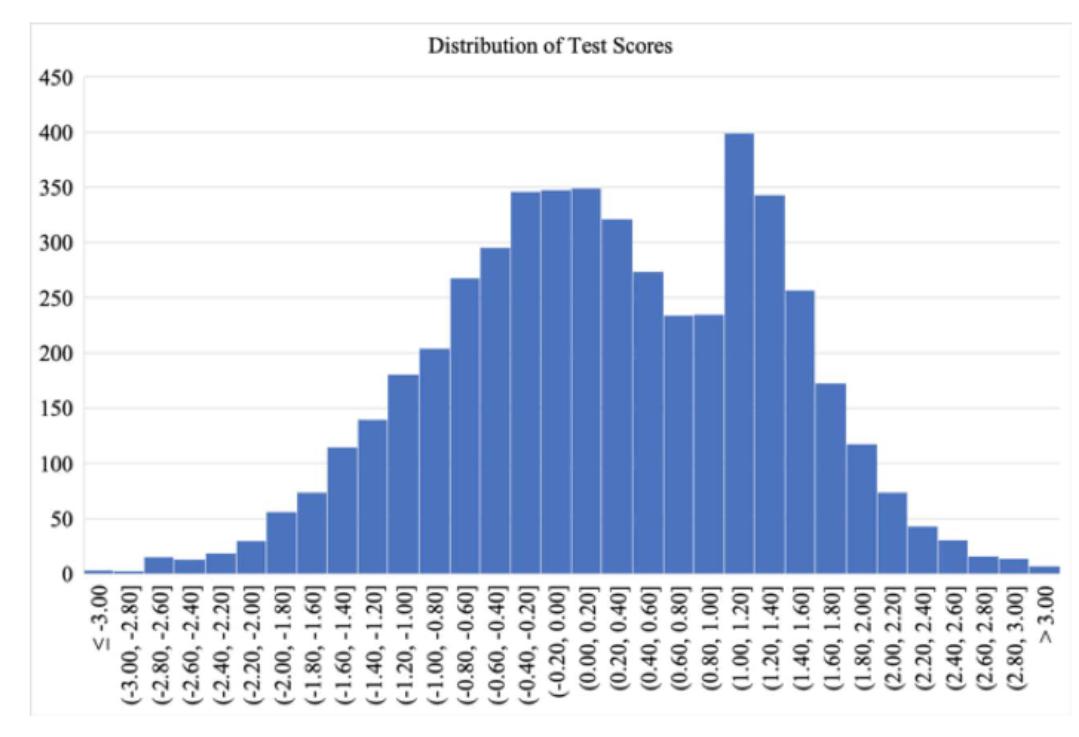
Question: a) What might explain this shape? b) Could your answer to (a) mean that there is a problem in using an RDD approach to study
a)
What might explain this shape?
b)
Could your answer to (a) mean that there is a problem in using an RDD approach to study the impact of admission to this school on college graduation rates?
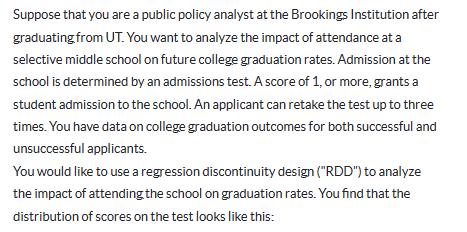
Suppose that you are a public policy analyst at the Brookings Institution after graduating from UT. You want to analyze the impact of attendance at a selective middle school on future college graduation rates. Admission at the school is determined by an admissions test. A score of 1, or more, grants a student admission to the school. An applicant can retake the test up to three times. You have data on college graduation outcomes for both successful and unsuccessful applicants. You would like to use a regression discontinuity design ("RDD") to analyze the impact of attending the school on graduation rates. You find that the distribution of scores on the test looks like this:
Step by Step Solution
There are 3 Steps involved in it
To conduct a regression discontinuity design RDD analysis to evaluate the impact of attendance at a ... View full answer

Get step-by-step solutions from verified subject matter experts