

Question: (a) With reference to Extract 1 and Figure 1, explain the effect on the total revenue of bottled water manufacturers following an increase in demand
(a) With reference to Extract 1 and Figure 1, explain the effect on the total revenue of bottled water manufacturers following an increase in demand for bottled water between 2008 and 2014. Use a supply and demand diagram in your answer. (5)
(b) Using a well-labelled cost/revenue diagram show how this increase in demand may affect a bottled water firms profits. (5)
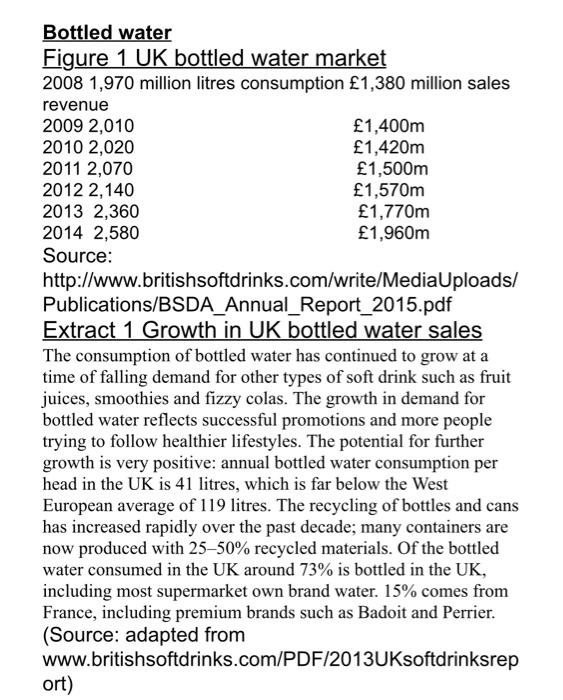
Bottled water Figure 1 UK bottled water market 2008 1,970 million litres consumption 1,380 million sales revenue 2009 2,010 1,400m 2010 2,020 1,420m 2011 2,070 1,500m 2012 2,140 1,570m 2013 2,360 1,770m 2014 2,580 1,960m Source: http://www.britishsoftdrinks.com/write/MediaUploads/ Publications/BSDA_Annual_Report_2015.pdf Extract 1 Growth in UK bottled water sales The consumption of bottled water has continued to grow at a time of falling demand for other types of soft drink such as fruit juices, smoothies and fizzy colas. The growth in demand for bottled water reflects successful promotions and more people trying to follow healthier lifestyles. The potential for further growth is very positive: annual bottled water consumption per head in the UK is 41 litres, which is far below the West European average of 119 litres. The recycling of bottles and cans has increased rapidly over the past decade; many containers are now produced with 2550% recycled materials. Of the bottled water consumed in the UK around 73% is bottled in the UK, including most supermarket own brand water. 15% comes from France, including premium brands such as Badoit and Perrier. (Source: adapted from www.britishsoftdrinks.com/PDF/2013UKsoftdrinksrep ort) Bottled water Figure 1 UK bottled water market 2008 1,970 million litres consumption 1,380 million sales revenue 2009 2,010 1,400m 2010 2,020 1,420m 2011 2,070 1,500m 2012 2,140 1,570m 2013 2,360 1,770m 2014 2,580 1,960m Source: http://www.britishsoftdrinks.com/write/MediaUploads/ Publications/BSDA_Annual_Report_2015.pdf Extract 1 Growth in UK bottled water sales The consumption of bottled water has continued to grow at a time of falling demand for other types of soft drink such as fruit juices, smoothies and fizzy colas. The growth in demand for bottled water reflects successful promotions and more people trying to follow healthier lifestyles. The potential for further growth is very positive: annual bottled water consumption per head in the UK is 41 litres, which is far below the West European average of 119 litres. The recycling of bottles and cans has increased rapidly over the past decade; many containers are now produced with 2550% recycled materials. Of the bottled water consumed in the UK around 73% is bottled in the UK, including most supermarket own brand water. 15% comes from France, including premium brands such as Badoit and Perrier. (Source: adapted from www.britishsoftdrinks.com/PDF/2013UKsoftdrinksrep ort)
Step by Step Solution
There are 3 Steps involved in it

Get step-by-step solutions from verified subject matter experts