

Question: a) Without the use of technology, make a scatter plot of the data.b) Draw a line of best fit on your graph from part a.c)
a) Without the use of technology, make a scatter plot of the data.b) Draw a line of best fit on your graph from part a.c) Determine the equation of the line of best fit.d) Describe the type of relationship and the strength of the relationship (strong, weak, positive, negative, linear, exponential, etc.).
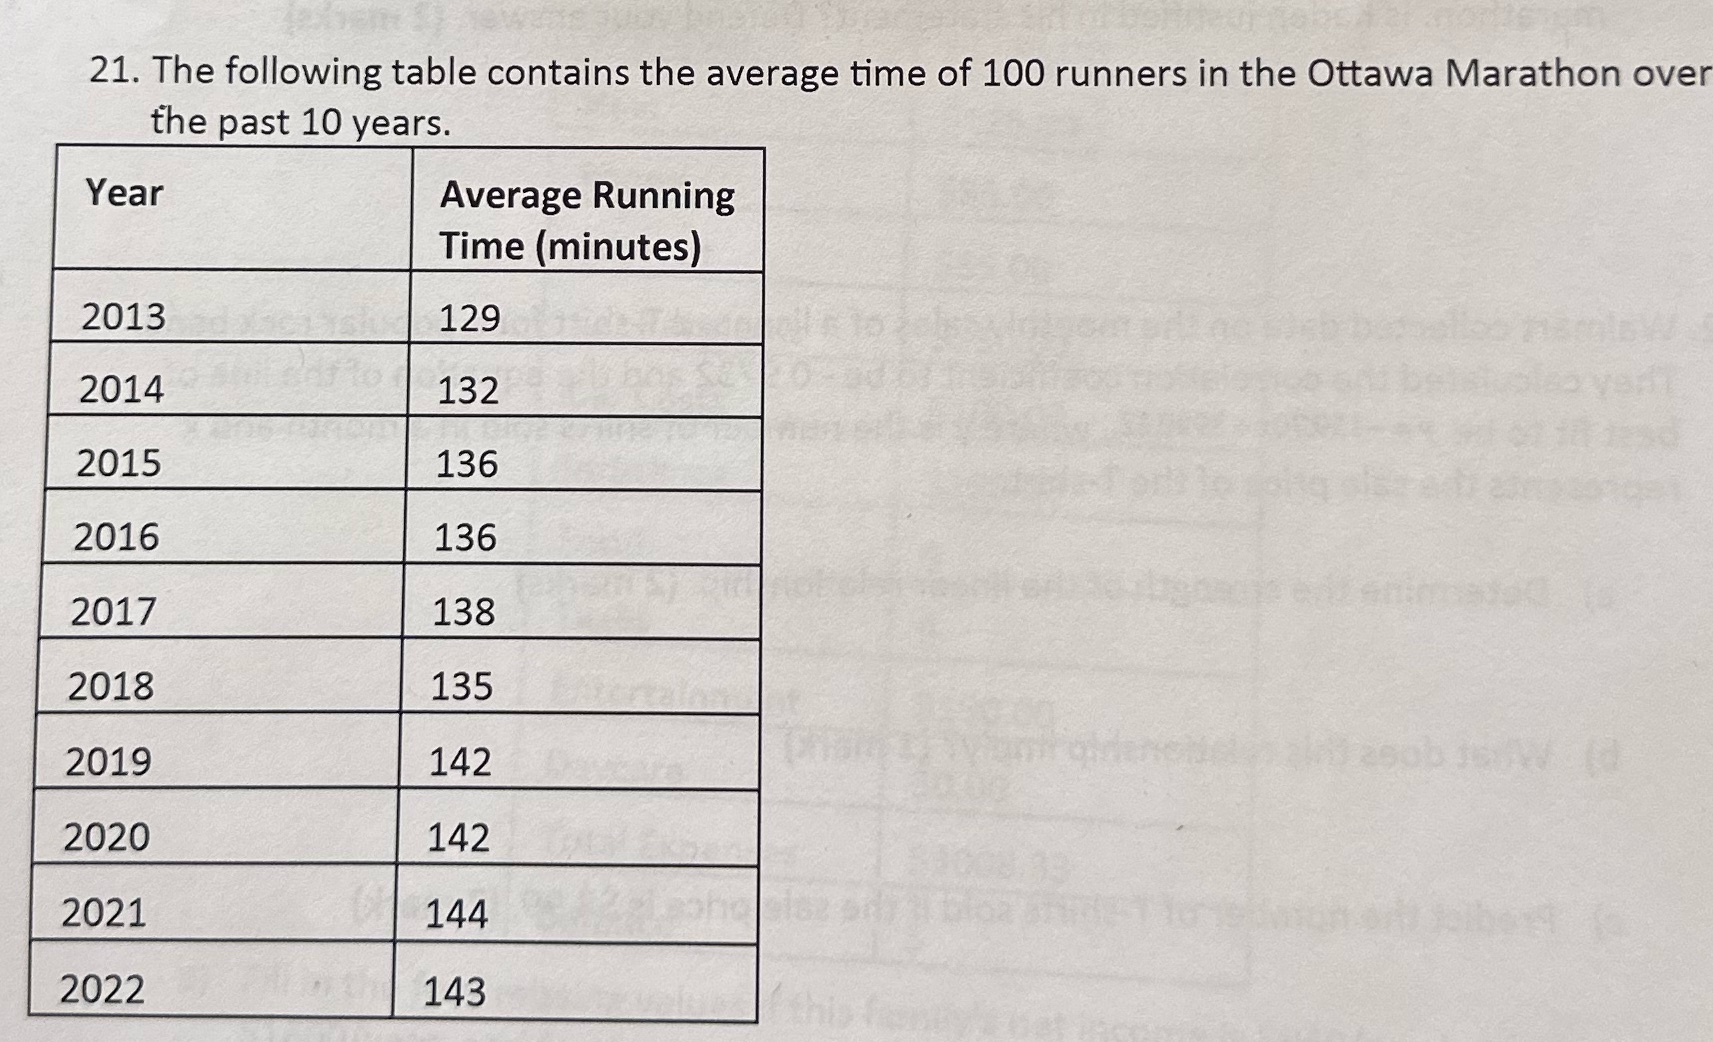
21. The following table contains the average time of 100 runners in the Ottawa Marathon over the past 10 years. Year Average Running Time (minutes) 2013 129 2014 132 2015 136 2016 136 2017 138 2018 135 2019 142 2020 142 2021 144 2022 143
Step by Step Solution
There are 3 Steps involved in it
1 Expert Approved Answer
Step: 1 Unlock

Question Has Been Solved by an Expert!
Get step-by-step solutions from verified subject matter experts
Step: 2 Unlock
Step: 3 Unlock